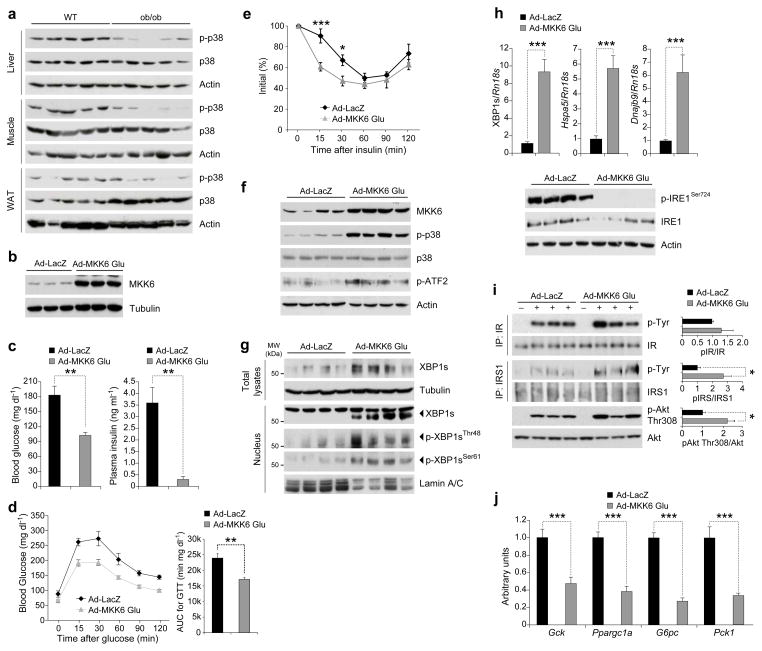
Figure 5.
Reactivation of p38 MAPK in the liver of ob/ob mice greatly enhances XBP1s nuclear translocation. (a) p-p38, p38 and actin levels in the liver, muscle and adipose tissues of eight-week-old WT and ob/ob mice. (b) MKK6 and tubulin protein levels in MEFs infected with Ad-LacZ or Ad-MKK6Glu. (c–j) Eight-week-old male ob/ob mice were infected with 8 x 10⁶ plaque-forming units (PFU) g−1 of Ad-LacZ (n=5) or Ad-MKK6Glu (n=5) via tail vein injection. (c) (left) Six-hour fasted blood glucose (mg dl−1) levels on day 3 and (right) circulating insulin levels at six-hour fasted state on day 7 after virus injections. (d–e) (d) Glucose tolerance test (GTT) on day 5 and (e) insulin tolerance test (ITT) on day 3 after virus injections. (f–j) On post-injection day 7, mice were sacrificed after 6-h fasting and liver tissues were collected. (f) MKK6, p-p38, p38, p-ATF2 and actin levels, (g) total XBP1s and tubulin as well as nuclear XBP1s, p-XBP1sThr48, p-XBP1sSer61 and lamin A/C levels. (h) (top) mRNA levels of XBP1s, Hspa5 and Dnajb9, (bottom) p-IRE1Ser724, total IRE1 and actin protein levels. (i) IR and IRS1 tyrosine and Akt Thr308 phosphorylations together with their total protein levels after insulin infusion (0.75 IU kg−1) through the portal vein on post-injection day 7. Graphs next to the blots depict the ratio between phospho- and total-protein. (j) mRNA levels of Gck, G6pc, Pck1 and Ppargc1a in the livers. Three independent groups of mice (n=15 total in each group) were used in the experiments. Error bars are ±S.E.M. Significance was determined by two-way ANOVA with Bonferroni multiple-comparison analysis (figure 5e) or Student’s t-test (*P<0.05, **P<0.01, ***P<0.001). AUC: Area under a curve.

