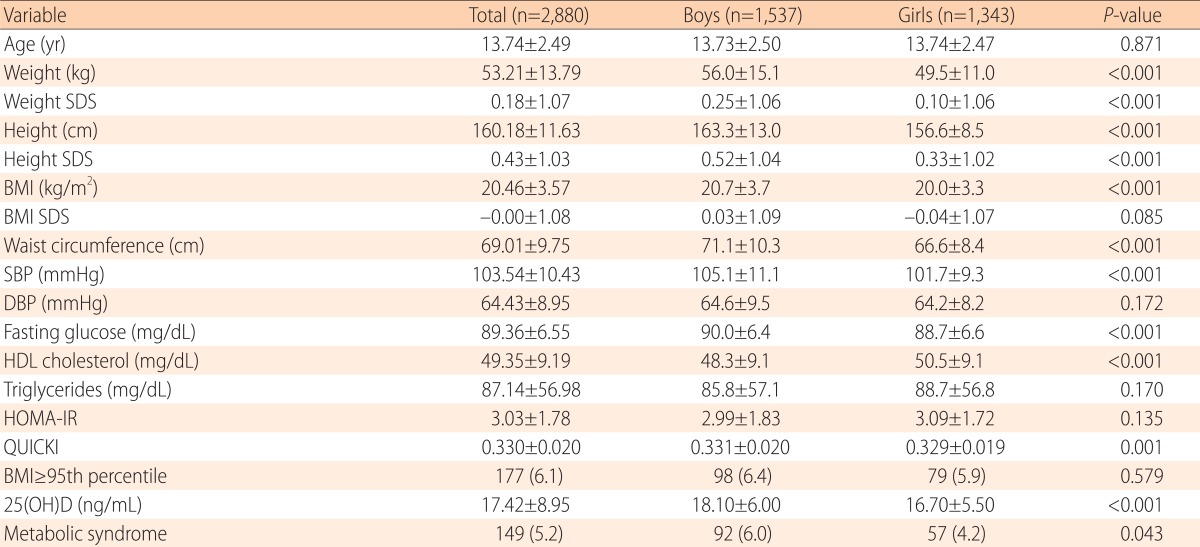
Table 1. Basic characteristics of the study subjects.

P-values were calculated as a comparison between boys and girls.
Values are presented as mean±standard deviation or number (%).
SDS, standard deviation score; BMI, body mass index; SBP, systolic blood pressure; DBP, diastolic blood pressure; HDL cholesterol, high density lipoprotein cholesterol; HOMA-IR, homeostasis model assessment of insulin resistance index; QUICKI, quantitative insulin sensitivity check index; 25(OH)D, 25-hydroxyvitamin D.
