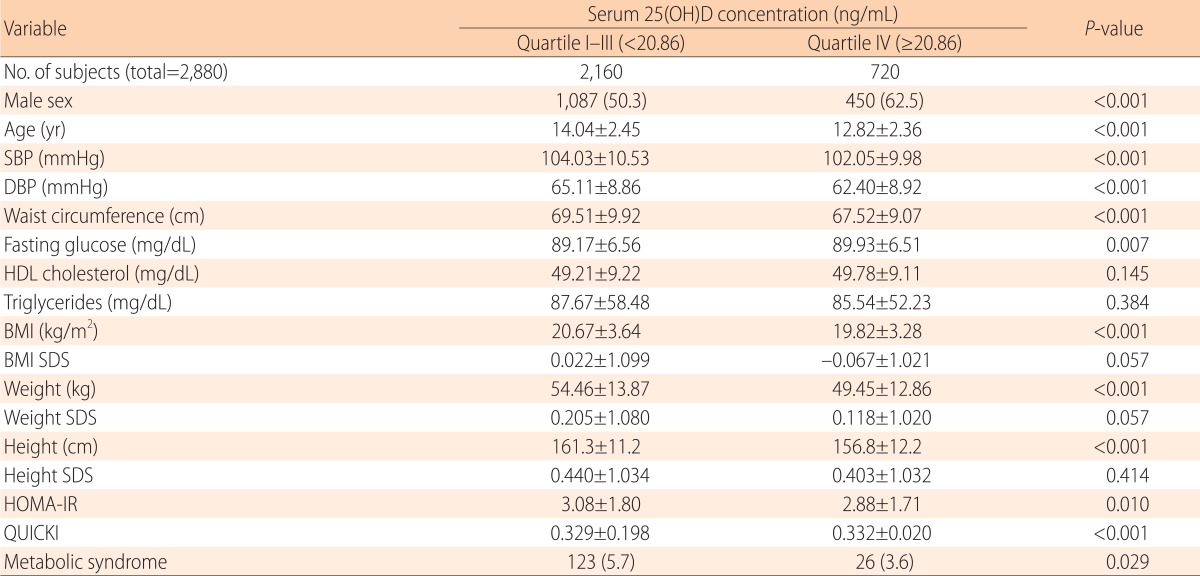
Table 3. Comparison of factors of metabolic syndrome, anthropometric indices, and insulin sensitivity index between serum 25(OH)D quartile I-III groups and quartile IV group.

P-value was calculated as a comparison between quartile I-III groups and quartile IV group.
Values are presented as number (%) or mean±standard deviation.
25(OH)D, 25-hydroxyvitamin D; SBP, systolic blood pressure; DBP, diastolic blood pressure; SDS, standard deviation score; HDL cholesterol, high density lipoprotein cholesterol; BMI, body mass index; HOMA-IR, homeostasis model assessment of insulin resistance index; QUICKI, quantitative insulin sensitivity check index.
