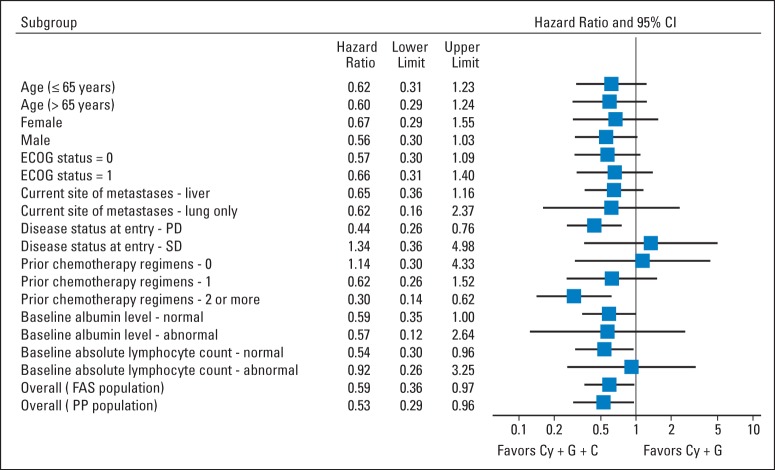
Fig 3.
Forest plot of treatment effect on overall survival in subgroup analyses. Horizontal lines represent 95% CIs. Position of each square represents point estimate of hazard ratio for treatment effect. Cy, cyclophosphamide; ECOG, Eastern Cooperative Oncology Group; FAS, full analysis set; PD, progressive disease; PP, per-protocol analysis set; SD, stable disease.

