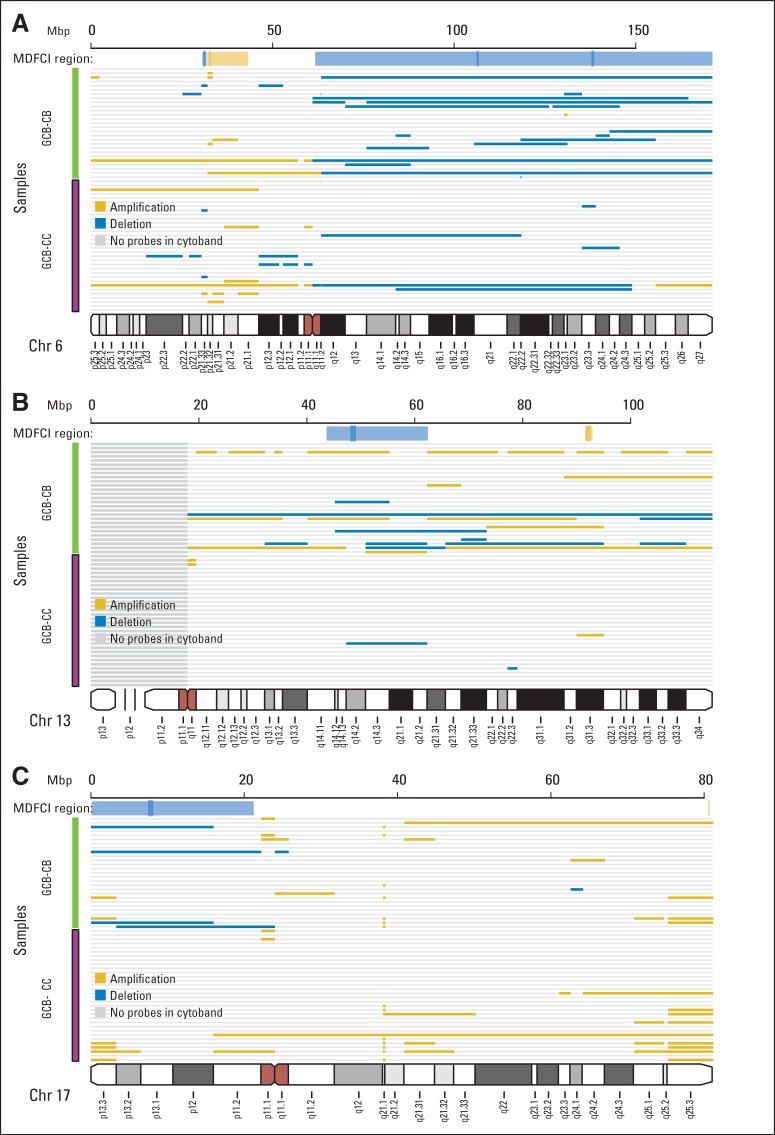
Fig 3.
Characterization of the genotypes of B-cell–associated gene signature (BAGS) subtypes. Copy number aberrations (CNAs) in the assigned subtypes were found at various chromosome positions when studied in 165 samples from Mayo Clinic, Brigham and Women's Hospital, and Dana-Farber Cancer Institute Project (MDFCI) with Affymetrix Genome-Wide Human SNP Array 6.0 and Affymetrix Gene Chip Human Genome U133 Plus 2.0 Arrays or U133A+B Arrays. (A) Graphical representation of CNAs on chromosome 6, (B) chromosome 13, and (C) chromosome 17 with copy numbers (CNs) averaged over each cytoband. A deletion was defined as an average CN of less than 1.62, and an amplification was defined as an average CN of more than 2.46. Gold indicates amplification, and blue indicates deletion. The subtype identity is color coded as follows: germinal center B-cell–like (GCB) centrocyte (CC) is purple, and GCB centroblast (CB) is green. Above each chromosome, the extents of the MDFCI peaks (dark gold for amplification and dark blue for deletion) and region (light gold for amplification and light blue for deletion) are shown.

