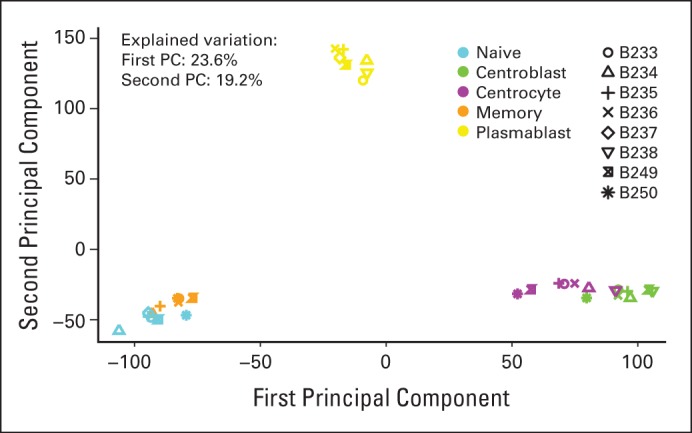
Fig A1.

Principal component (PC) analysis identified distinct B-cell subset clusters. PC analysis was performed based on all probe sets for all samples (n = 8). The second PC is plotted versus the first PC. All subsets segregated into distinct clusters, albeit with relatively minor separation between the centroblast and centrocyte clusters and between the naive and memory clusters. The first and second PCs explained 23.6% and 19.2% of the variation, respectively. Notably, the analysis was conducted on all probe sets, resulting in a large number of noise probes, which explains the large proportion of the variation explained by the first PC.
