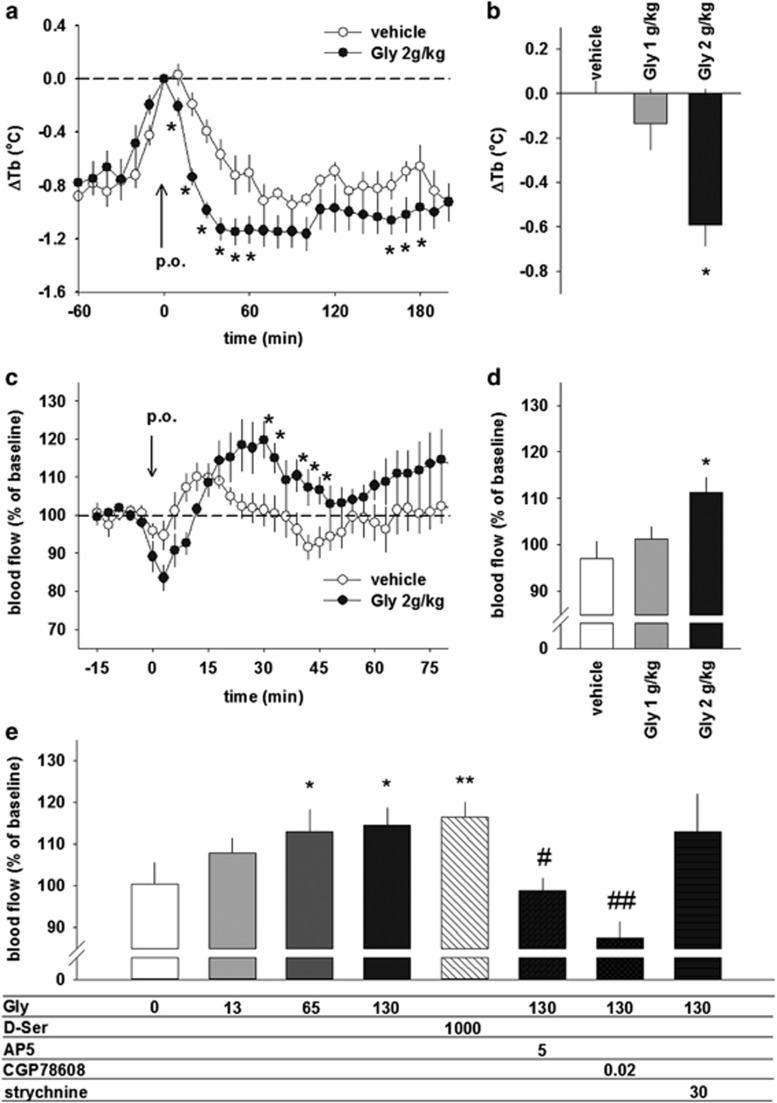
Figure 2.
Dose-dependent decreases in core body temperature and increases in skin blood flow following peripheral and central administration of glycine. (a) The changes in rat core body temperature (Δcore body temperature) were recorded from 60 min before administration. Each symbol represents the mean±SEM (N=8). (b) The difference in Δcore body temperature 30 min after oral administration between the vehicle treatment group and the 1- or 2-g/kg glycine treatment group. The data are presented as the mean±SEM. *p<0.05 values are based on comparisons with the vehicle treatment group. (c) Changes in cutaneous blood flow (CBF) were recorded from 15 min before oral administration. Each symbol represents the mean±SEM (N=8–10). (d) The ratio of CBF 30–45 min after oral administration to 0–15 min before administration (baseline). (e) The effect of intracerebroventricular administration of glycine and glycine-related compounds on CBF. The data are presented as the mean±SEM (N=5–10). *p<0.05 values are based on comparisons with baseline. #p<0.05, ##p<0.01 values are based on comparisons with the absence of inhibitors of NMDA receptors or glycine receptors.

