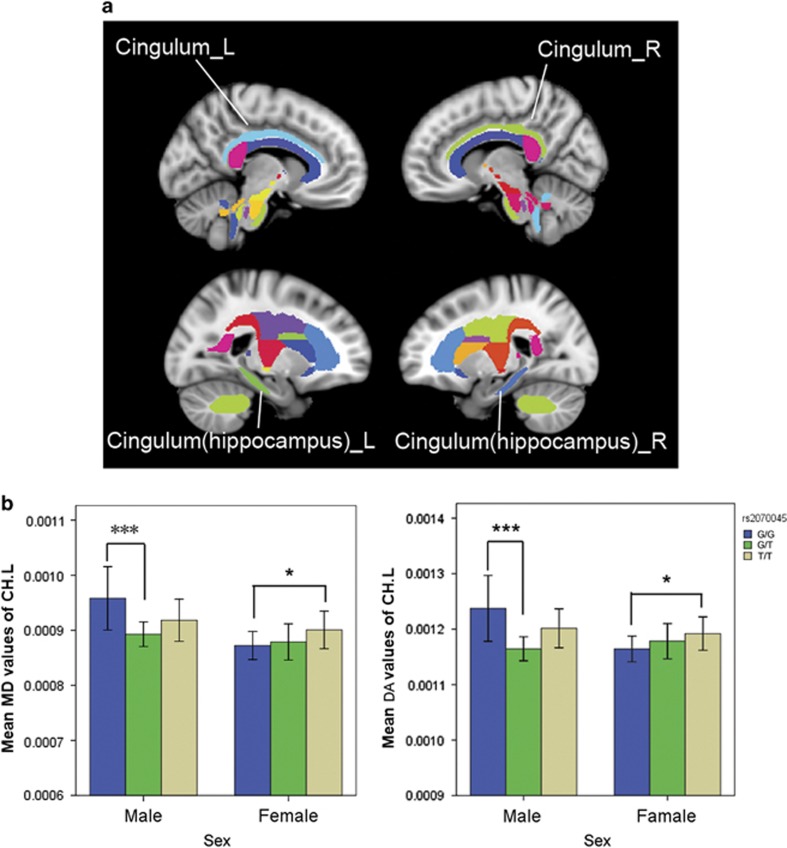
Figure 1.
Mean diffusion metrics of the atlas-based tracts in the gene and sex groups. (a) The JHU white matter atlas in the ICBM-DTI-81 space. Colored regions indicate the bilateral cingulum and cingulum hippocampal part. (b) Post-hoc differences in the mean diffusion metrics of the atlas-based tracts among groups. *P<0.05 uncorrected. ***P<0.05 in Tukey's test. DA, axial diffusivity; MD, mean diffusivity.

