. 2015 Apr 1;56(3):705–711. doi: 10.3349/ymj.2015.56.3.705

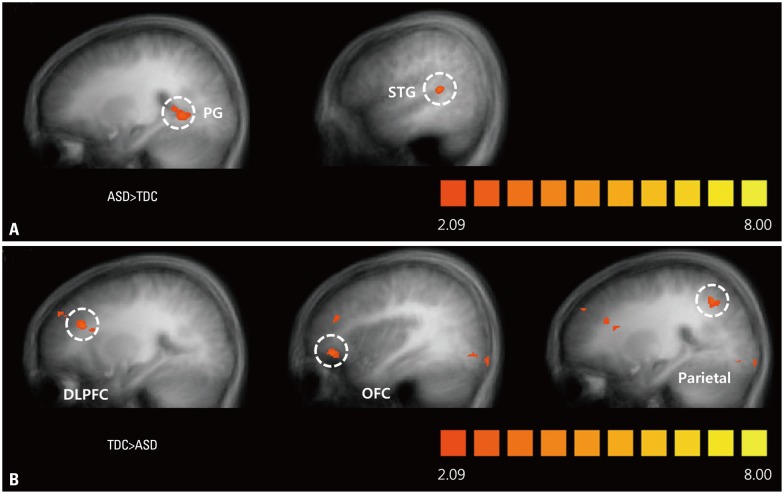
Fig. 2. Different brain activation maps of ASDs and TDCs with a social reward learning effect. (A) Different brain activation maps of the ASDs> the TDCs contrast. The parahippocampal gyrus and superior temporal cortex were observed (ANOVA analysis with random effect GLM, p<0.01, uncorrected). (B) Different brain activation maps of the TDCs> the ASDs contrast. The dorsolateral prefrontal cortex, orbitofrontal cortex and parietal lobe were observed (ANOVA analysis with random effect GLM, p<0.01, uncorrected). ANOVA, analysis of variance; GLM, general linear model; ASD, Autism Spectrum Disorder; TDC, typically developing control; PG, parahippocampal gyrus; STG, superior temporal gyrus; DLPFC, dorsolateral prefrontal cortex; OFC, orbitofrontal cortex.

Fig. 2