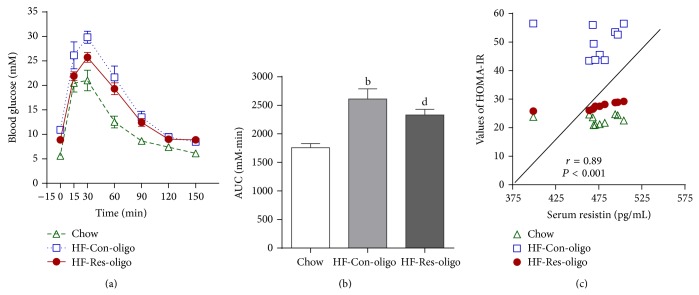
Figure 2.
Effects of antiresistin RNA oligo on intraperitoneal i.p. glucose tolerance test. (a) Blood glucose response to i.p. glucose injection, (b) area under the curves (AUC) of glucose profile values in chow fed mice and HFD fed mice treated with a control oligo or antiresistin RNA oligo, and (c) the correlations between serum levels of resistin and whole-body insulin sensitivity index (HOMA-IR). Data are mean ± SE (n = 10 each group). b P < 0.01 versus chow fed mice; e P < 0.05 versus HF-Con-oligo mice.

