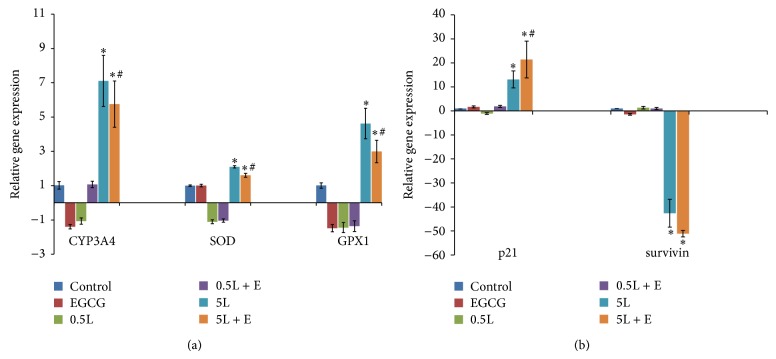
Figure 3.
qRT-PCR results of (a) CYP3A4, SOD, and GPX1 gene expression and (b) p21 and survivin gene expression in A549 cells treated for 48 h. Total RNA was collected from the treated cells following the RNeasy kit instructions. Total RNA (50 ng) was then amplified using a one-step RT-PCR kit with SYBR green. The Ct values of the genes of interest were normalized to GAPDH and the fold-change in gene expression was calculated using the ΔΔCt method. Nontemplate controls were included in every experiment. E: 20 μM EGCG; 0.5L: 0.5 nM LMB; 5L: 5 nM LMB; ∗ P < 0.05 as compared to control; # P < 0.05 as compared to 5 nM LMB.

