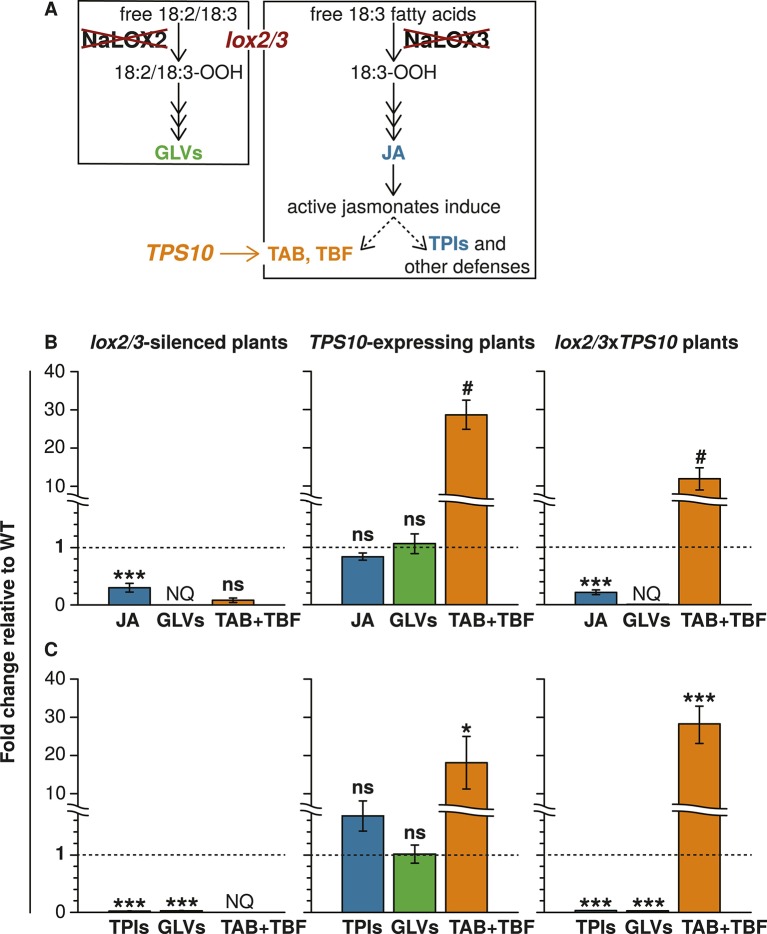
Figure 1. The lox2/3 and TPS10 transgenic constructs, alone and in combination (lox2/3xTPS10), independently alter herbivore-induced plant defenses and sesquiterpene HIPVs.
(A) The endogenous lipoxygenase genes LOX2 and LOX3 and the Z. mays sesquiterpene synthase gene TPS10 (TPS10) were manipulated in transgenic lines of N. attenuata in order to uncouple the production of two HIPVs—the sesquiterpenes (E)-α-bergamotene (TAB) and (E)-β-farnesene (TBF)—from jasmonate-mediated direct defenses and other volatiles. LOX2 and LOX3 provide fatty acid hydroperoxides from 18:2 and 18:3 fatty acids (18:2/18:3-OOH) for the synthesis of green leaf volatiles (GLVs) or jasmonic acid (JA) and the jasmonate-derived hormones, respectively. GLVs are released in response to herbivore damage, and jasmonates regulate the production of most anti-herbivore defenses, including trypsin protease inhibitors (TPIs), and other HIPVs. LOX2 and LOX3 were transgenically silenced using an inverted repeat (ir) construct specifically silencing both (lox2/3). Jasmonate-regulated volatiles in N. attenuata are mostly sesquiterpenes, of which the most prevalent is TAB, and include trace amounts of the biosynthetically related sesquiterpene TBF. The Z. mays sesquiterpene synthase TPS10 (Köllner et al., 2009), which produces TAB and TBF as its main products, was ectopically over-expressed in N. attenuata plants under control of a 35S promoter (TPS10) to uncouple the emission of these volatiles from endogenous jasmonate signaling. (B and C) Plants with lox2/3 and TPS10 constructs, and a cross with both constructs having the transgenes in a hemizygous state (lox2/3xTPS10) had the expected phenotypes both in glasshouse and field experiments. For each compound or group of compounds, the mean WT value was set to 1 (indicated by dashed lines), and all values were divided by the WT mean resulting in mean fold changes ±SEM. A complete description of TPS10 plants including the demonstration of a single transgene insertion and WT levels of non-target metabolites is provided in Schuman et al. (2014), and additional information for lox2/3, TPS10, and lox2/3xTPS10 plants (single transgene insertion for lox2/3, accumulation of target gene transcripts) is given in Appendix 1. (B) Glasshouse-grown plants were treated with wounding and M. sexta OS, and JA, GLVs, TAB and TBF were analyzed at the time of peak accumulation; n = 4. For lox2/3 and lox2/3xTPS10, GLVs were not quantifiable (NQ) by GC–MS due to inconsistently detected or no detected signals. ***p<0.001 in Tukey HSD tests following a significant one-way ANOVA (p<0.001) of WT, lox2/3, and lox2/3xTPS10; # plants with the TPS10 construct emit significantly more TAB + TBF (Holm-Bonferroni-corrected p<0.01 in a Wilcoxon rank sum test of WT and lox2/3 vs lox2/3xTPS10 and TPS10); ns, not significant. TBF was not detectable in lox2/3 or WT samples. For absolute amounts of JA and other phytohormones, GLVs, TAB and TBF measured in glasshouse samples, see Figure 1—source data 1, 2. (C) TPI activity, total detectable GLVs, and total TAB and TBF measured in frozen leaf samples harvested from field-grown plants at the end of experimental season two (June 28th), after plants had accumulated damage from naturally occurring herbivores. TPIs (n = 11–24) were slightly elevated in field samples of TPS10 plants, but TPI activity did not differ from WT plants in glasshouse samples from two independent TPS10 lines including the line used for this study (Schuman et al., 2014). Total GLVs, TAB, and TBF were quantified by GC–MS in hexane extracts from the same tissue samples used to measure TPI activity, n = 9–22 (a few samples had insufficient tissue for the analysis). Neither TAB nor TBF could be detected in lox2/3 samples (NQ); TBF was also not detectable in WT samples. *Corrected p<0.05, ***corrected p<0.001 in pairwise Wilcoxon rank sum tests following significant (corrected p<0.05) Kruskal–Wallis tests across all genotypes for each category; p-values were corrected for multiple testing using the Holm-Bonferroni method; ns, not significant. For absolute amounts of TPIs, GLVs, TAB and TBF, and non-target volatiles measured in field-collected tissue samples, see Figure 1—source data 3; emission of GLVs, TAB, TBF, and non-target volatiles from field-grown plants is given in Appendix 2.
DOI: http://dx.doi.org/10.7554/eLife.04490.003

