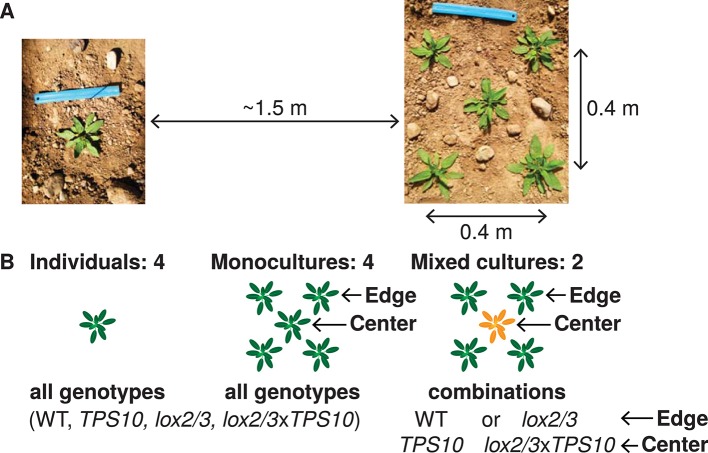
Figure 2. Field experiments designed to measure genotype-by-population effects of TPS10 volatiles in well-defended (WT, TPS10) or poorly defended (lox2/3, lox2/3xTPS10) plants.
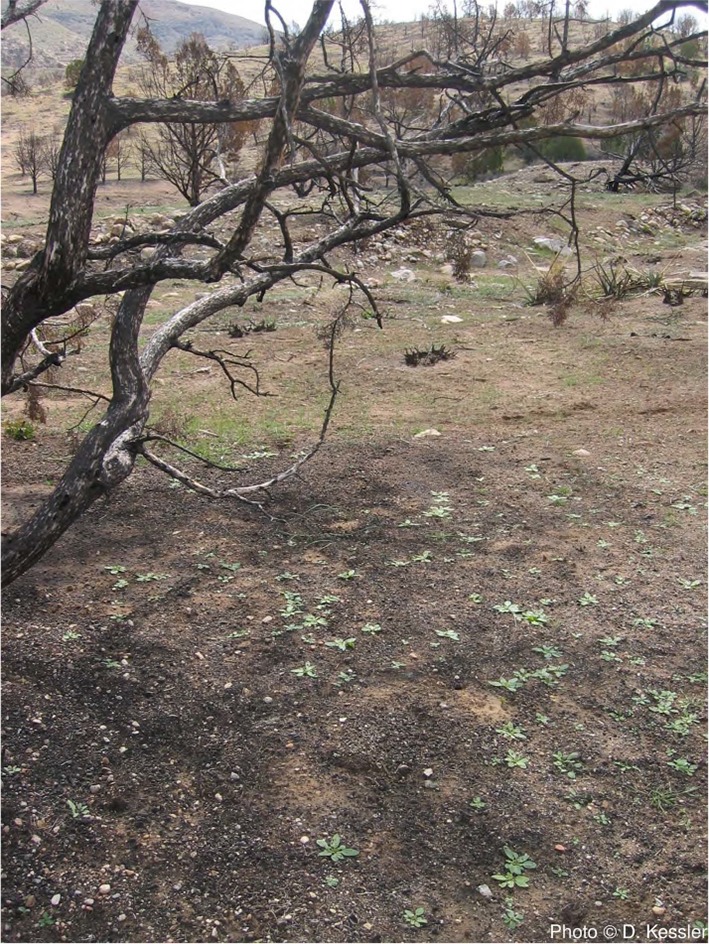
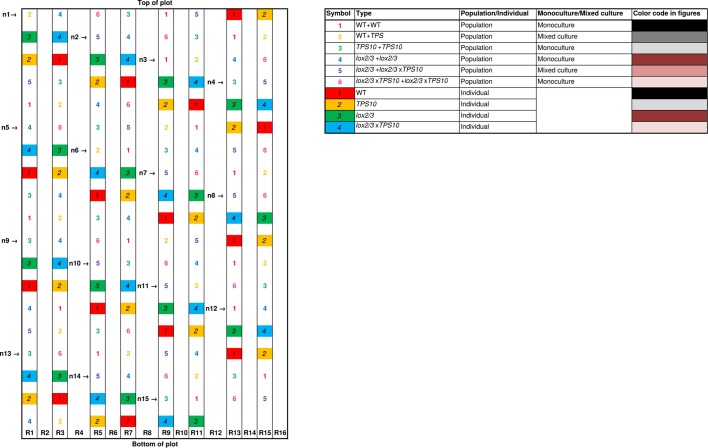
Two similar experiments were conducted in two consecutive field seasons. (A) Each genotype was planted as individuals and in five-plant populations (see Figure 2—figure supplement 1). Each individual or population was planted ca. 1.5 m from the nearest neighboring individual/population, measured perimeter-to-perimeter. Populations consisted of five plants arranged as shown in a 0.4 × 0.4 m square. (B) Individual and population types: monocultures and, additionally, mixed cultures were planted in which a TPS10 plant (TPS10 or lox2/3xTPS10) was surrounded by four plants of the same level of jasmonate-mediated defense and GLVs (WT or lox2/3). Replicates (n = 12 in season one, 15 in season two of each individual or population type) were arranged in a blocked design (see Figure 2—figure supplement 2): blocks consisting of one replicate of each type (all six randomly-ordered populations followed by all four randomly-ordered individuals) were staggered such that consecutive blocks were not aligned, and thus populations and individuals were also interspersed. Random order was modified only when necessary to ensure that no two replicate individuals/populations were placed next to each other vertically, horizontally, or diagonally. This planting design reflects typical distributions in native populations of Nicotiana attenuata (see Figure 2—figure supplement 3), particularly before 1995, after which an invasive brome grass fueled a dramatic increase in fire sizes and consequently N. attenuata population sizes.
Figure 2—figure supplement 1. Photographs of the field experiment in season one.
Figure 2—figure supplement 2. Layout in experimental season two, and color codes.
Figure 2—figure supplement 3. Example of plant distribution in a native N. attenuata population, photographed in 2004.


