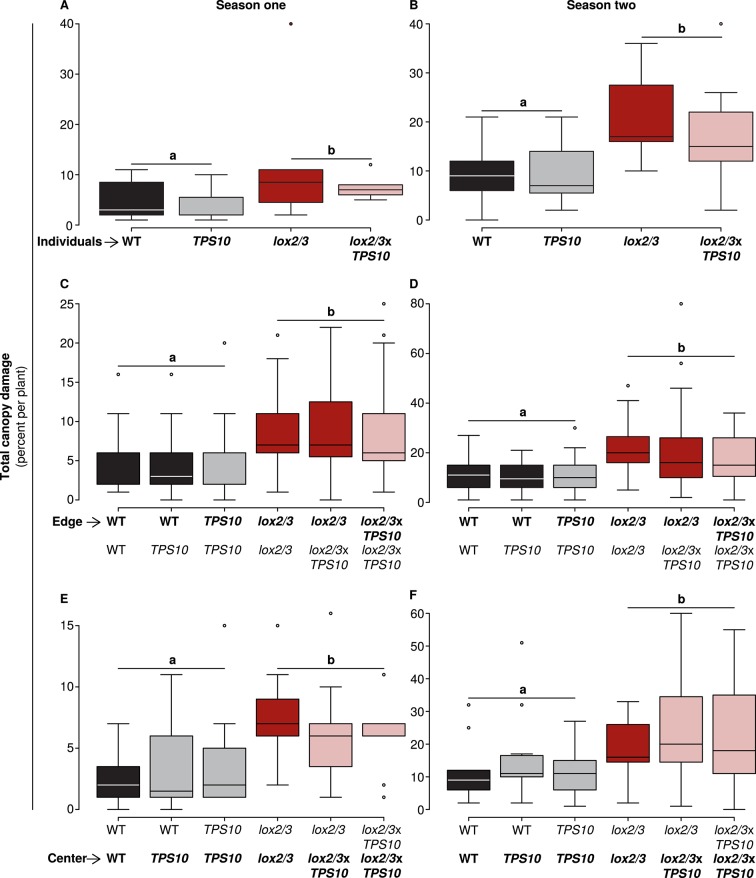
Figure 5. Only LOX2/3 and not TPS10, plant position, or population type determined total foliar damage from herbivores over two consecutive field seasons.
Note differences in y-axis scale. Data were collected on June 9th in season one (left panels), and on June 2nd in season two (right panels) from plants at all different positions in the experiment: individual plants (A–B), and plants at the edges (C–D) or at the centers (E–F) of populations. Black bars denote WT, grey bars TPS10, red bars lox2/3, and pink bars lox2/3xTPS10 plants. Total canopy damage reflected the trends in canopy damage caused by individual herbivores (Figure 5—source data 1, 2). Total canopy damage in season one was low (left panels), ranging from 5–10% on lox2/3 and lox2/3xTPS10 plants, and only 2–5% on WT and TPS10 plants. Damage levels were about twice as high in season two (right panels), but showed the same relative pattern, with LOX2/3-deficient plans having more damage. Damage levels within a season were similar for plants in different positions (p>0.07, see Appendix 3). a,b Different letters indicate significant differences (p<0.05) between LOX2/3-expressing and LOX2/3-deficient plants (WT, TPS10 v. lox2/3, lox2/3xTPS10) in minimal ANOVA or linear mixed-effects models on arcsin-transformed data. For individuals and center plants n = 7–13, and for edge plants n = 16–48 (up to 4 per population; the blocking effect was accounted for by a random factor in statistical analysis); exact replicate numbers are given in Figure 5—source data 1, 2. There were no significant differences in damage between plants differing only in TPS10 expression (p>0.4), plants in mono- vs mixed cultures (p>0.5), or plants of the same genotype at different positions (individual, edge, or center, p>0.07). Statistical models are given in Appendix 3.
DOI: http://dx.doi.org/10.7554/eLife.04490.013

