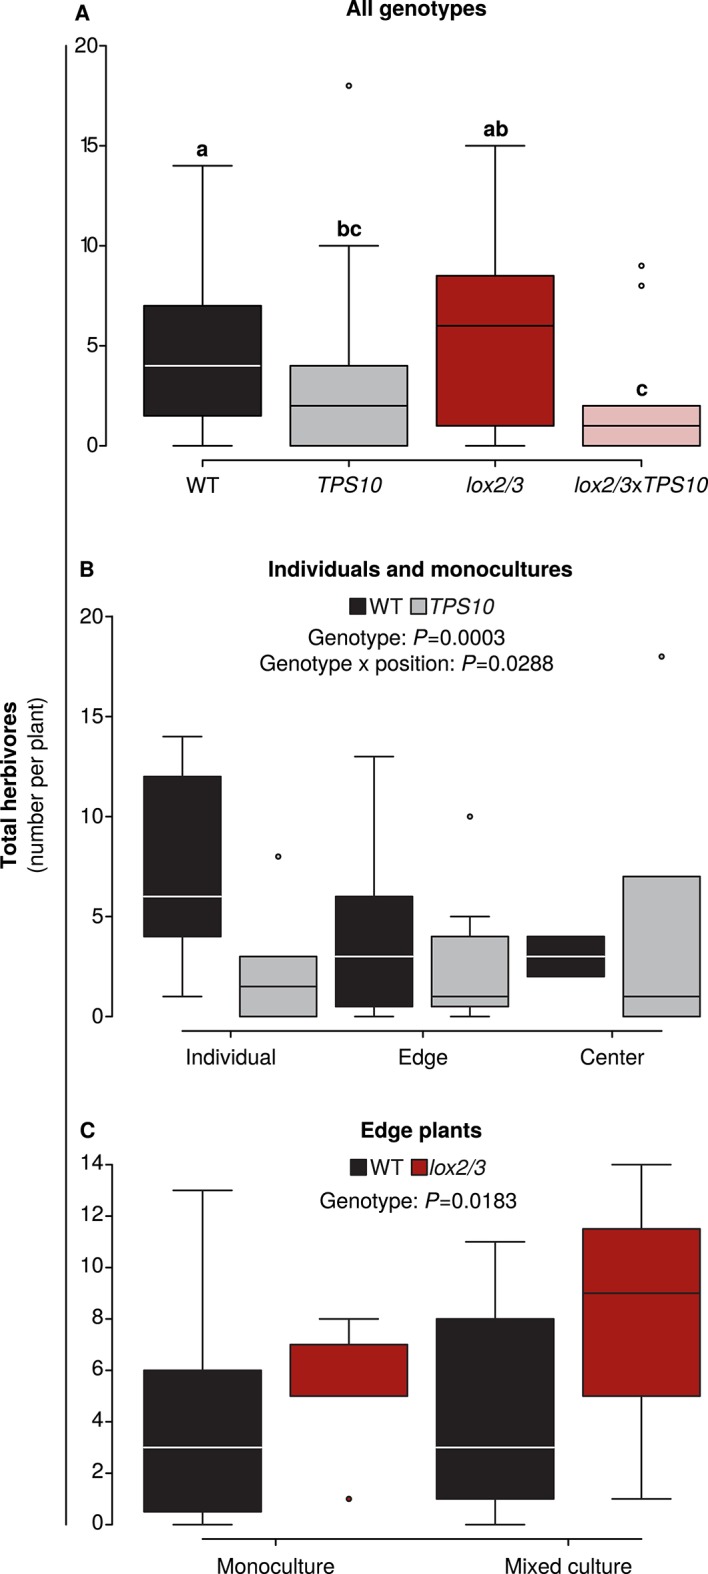
Figure 6. Foliar herbivore abundance is determined by TPS10 expression, lox2/3 expression, and plant position.

Data were collected on June 26th in season two, when herbivores and predators were more abundant (see Figure 5). Black denotes WT, grey TPS10, red lox2/3, and pink lox2/3xTPS10 plants. Counts for individual herbivores and predators are given in Figure 6—source data 1, 2. (A) Herbivore counts on focal plants of each genotype revealed fewer herbivores present on plants expressing TPS10 (n given in Figure 6—source data 1). a,b Different letters indicate significant differences (corrected p<0.05) between genotypes in Tukey contrasts following significant differences in a generalized linear mixed-effects model (see Appendix 3). (B) For WT and TPS10 individuals or plants in monocultures (n given in Figure 6—source data 2), there was a significant effect (p<0.05) of plant genotype (z = −3.662, p=0.0003) and an interaction of genotype with position (TPS10 by center vs individual position, z = 2.186, p=0.0288, generalized linear mixed-effects model in Appendix 3). (C) The presence of a TPS10-expressing neighbor in mixed populations did not significantly affect herbivore abundance on WT or lox2/3 edge plants, but there was a significant difference between WT and lox2/3 genotypes at the edges of populations (n given in Figure 6—source data 2, z = 2.358, p=0.0183, generalized linear model in Appendix 3).
DOI: http://dx.doi.org/10.7554/eLife.04490.016
