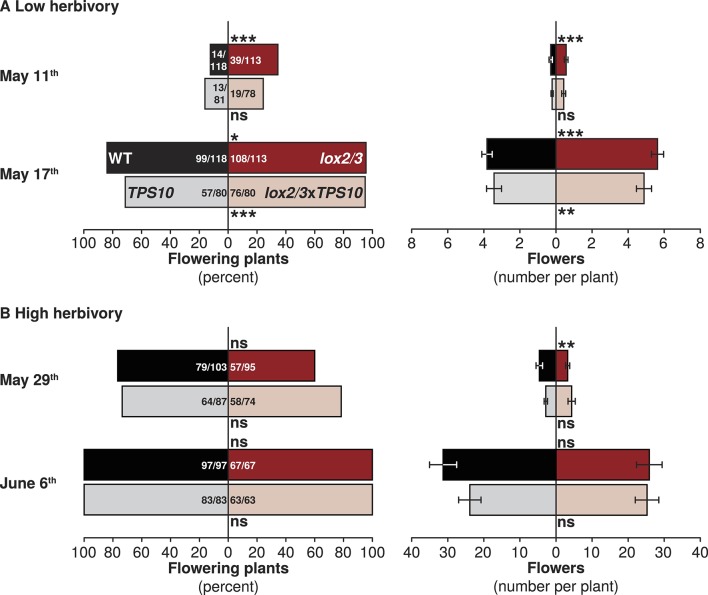
Figure 7. LOX2/3 deficiency accelerated flowering under low herbivory.
Flower production was monitored twice per season: once shortly after plants began to flower and again 1 week later, when most or all plants were flowering. Bars indicate either total percentage of plants of each genotype which were flowering (left panels), or the mean number of flowers per plant (right panels). WT and TPS10 (black and grey bars) are shown opposite lox2/3 and lox2/3xTPS10 (red and pink bars). Ratios in bars indicate numbers of flowering/total plants monitored; a few plants were not included in counts which had recently lost their main stem to herbivores and had not yet re-grown. (A) In season one, when plants suffered less damage from herbivores (Figure 5), plants with the lox2/3 silencing construct produced more flowers earlier: asterisks indicate pairwise differences between genotypes differing only in the lox2/3 silencing construct. ***Corrected p<0.001, **corrected p<0.01, *corrected p<0.05, or no significant difference (ns) in G-tests (percentage flowering) or in Wilcoxon rank sum tests (flower number, WT vs lox2/3: May 11th, W120,120 = 8582, p=0.0002; May 17th, W120,119 = 5043, p<0.0001; TPS10 vs lox2/3xTPS10: May 11th, W84,84 = 3801, p=0.2063; May 17th, W84,84 = 2520, p=0.0027). (B) In season two, during which plants received more damage from herbivores (Figure 5), flowering was monitored at later dates: the first timepoint in (B) is comparable to the second timepoint in (A) in terms of the proportion of plants flowering and the average number of flowers per plant (note difference in scale). In season two, LOX2/3 deficiency rather decreased early flower numbers in the comparison of WT vs lox2/3 on May 29th, and did not increase flower numbers at either measurement (WT vs lox2/3: May 29th, W103,95 = 3860.5, p=0.0091; June 6th, W97,69 = 2940.5, p=0.3018; TPS10 vs lox2/3xTPS10: May 29th, W87,74 = 3646.5, p=0.1417; June 6th, W83,63 = 2695, p=0.7518). For a complete analysis of the effects of LOX2/3 deficiency and TPS10 expression, plant position, and population type on flowering and plant size, see source data file for Figure 8.

