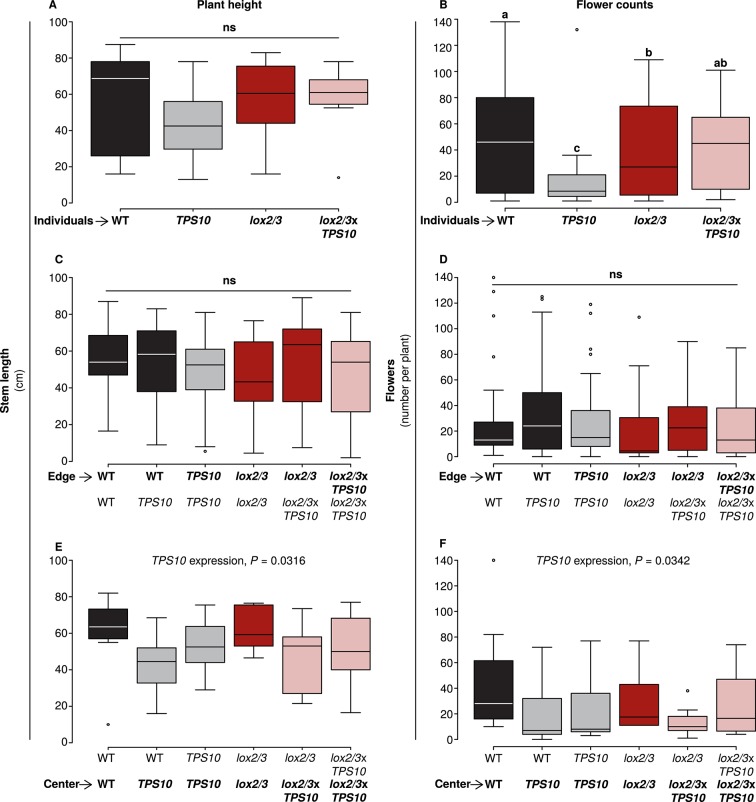
Figure 8. TPS10 expression reduced flower production under high herbivory.
Plant size as measured by stem length (left panels), and reproduction as measured by flower production (right panels); n given in Figure 8—source data 1. Data were collected on June 6th in season two from plants at all different positions in the experiment: individual plants (A–B), and plants at the edges (C–D) or at the centers (E–F) of populations. Black bars denote WT, grey bars TPS10, red bars lox2/3, and pink bars lox2/3xTPS10 plants. Plant height differed little, with only a small negative effect of TPS10 expression for center plants (E), which was more pronounced in mixed- than monocultures, indicating a slight competitive disadvantage for these plants. Individual plants differed much more than plants in populations in terms of flower production, with TPS10-expressing plants at a disadvantage (B); this effect was greatly reduced in populations.a,b Different letters indicate significant differences (corrected p<0.05) in Tukey post-hoc tests on plant genotype following significant effects in a generalized linear model, or generalized linear mixed-effects model (C–D) with genotype as a factor; these p-values were corrected using the Holm-Bonferroni correction for multiple testing as the same data were also tested for effects of LOX2/3 deficiency and TPS10 expression (see Figure 8—source data 1). There was no difference in flower production for edge plants, but a small negative effect of TPS10 expression on flower production in center plants (F) corresponding to the slight reduction in height of these plants (E). Statistical models are given in Figure 8—source data 1.
DOI: http://dx.doi.org/10.7554/eLife.04490.020

