Table 2.
Overview of SENP inhibitors identified using virtual screening.
| SENP target | Structure of representative compounds | Activity of most potent compounds | Virtual screening method used | Reference |
|---|---|---|---|---|
| SENP1 |  |
Compound 9 IC50 = 2.38 μM Compound 10 IC50 = 1.08 μM |
Molecular docking of 180,000 compound library using Glide program. | Chen et al. [70] |
| SENP1, SENP2, SENP7 |  |
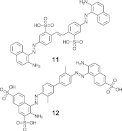
Compound 11 SENP1 IC50 = 5.9 μM SENP2 IC50 = 2.9 μM SENP7 IC50 = 3.5 μM Compound 12 SENP1 IC50 = 2.1 μM SENP2 IC50 = 2.0 μM SENP2 IC50 = 2.7 μM |
Molecular docking of 250,000 compound library using Glide program. | Madu et al. [71] |
| SENP1, SENP2 |  |
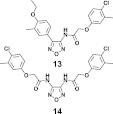
Compound 13 SENP1 IC50 = 9.7 μM SENP2 IC50 = 5.9 μM Compound 14 SENP1 IC50 = > 30 μM SENP2 IC50 = 3.7 μM |
Hierarchical virtual screening of ~ 4 million compound library by shape and electrostatic similarity search using ROCS and EON program. Molecular docking using Glide program prioritized hits for bioassay. | Kumar et al. [72] |
| SENP1 |  |
Compound 15 IC50 = 1.29 μM |
Molecular docking of 100,000 compound library using Dock and Autodock program. | Wen et al. [73] |
