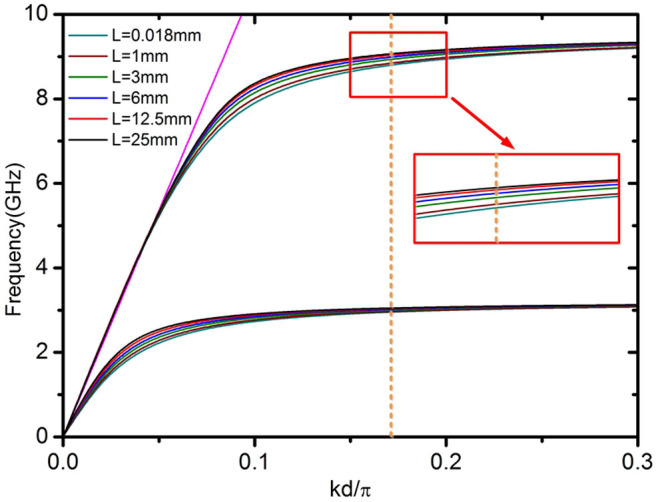
Figure 6. Spoof SPP dispersion bands for groove arrays of different thicknesses, L, and a = 0.5d, h = 23 mm,and d = 1.4 mm (parameters equivalent to the texture in Fig. 5).

Two different set of modes can be observed, each of which can be associated with a different divergences for the tangent function in Eq. (2). The lower (upper) band is linked to the resonant condition k0h = π/2 (k0h = 3π/2), and correspond to the fundamental (second order) spoof SPP mode. The orange dashed line shows the resonance condition (k = n/R) for the decapole resonance in Fig. 5. The inset shows an enlargement of the second-order dispersion, which explains qualitatively the LSP red-shifting with decreasing L observed in Fig. 5.
