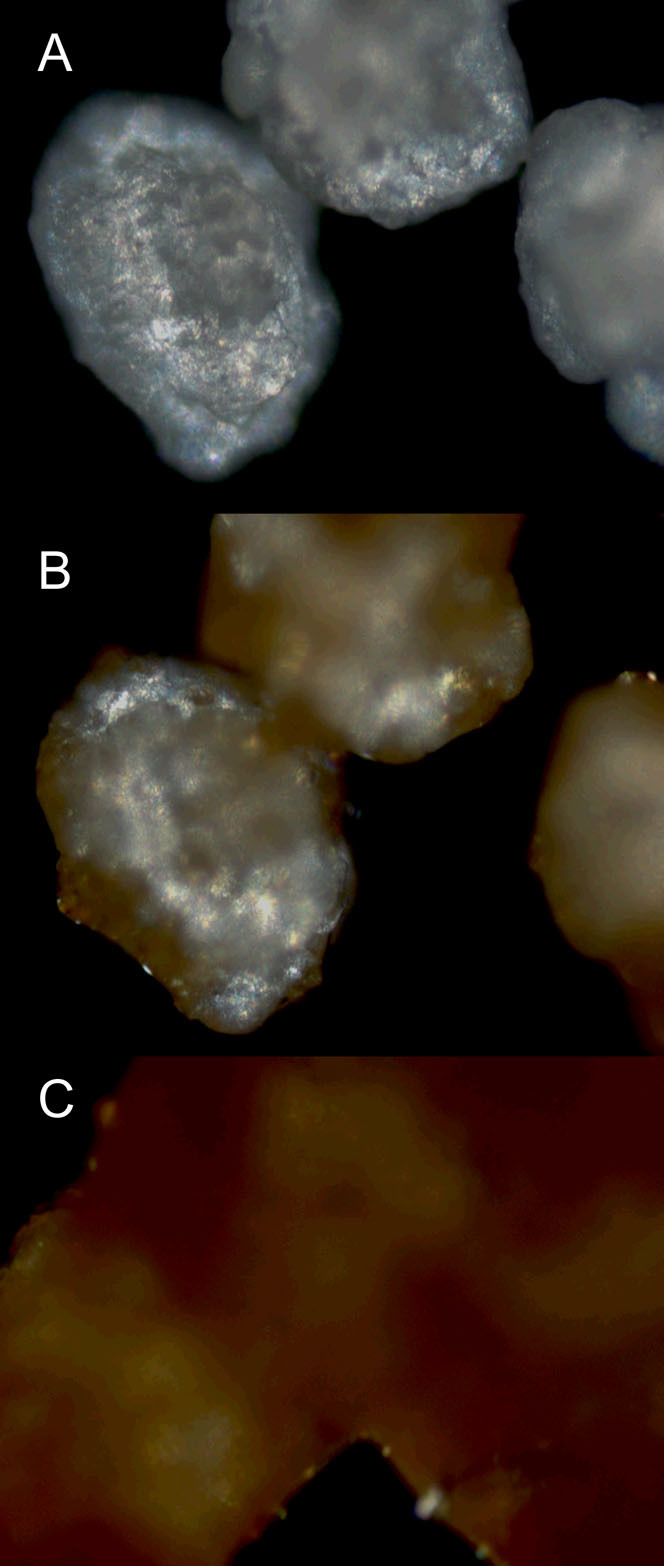
Figure 2. Images of sucralose crystals submitted to HSM analysis.

(A) presents the crystals after heating; (B) shows the pre-melting stage and (C) shows the complete melting/caramelization of the crystals.

(A) presents the crystals after heating; (B) shows the pre-melting stage and (C) shows the complete melting/caramelization of the crystals.