
Figure 2. Images of sucralose crystals submitted to HSM analysis.
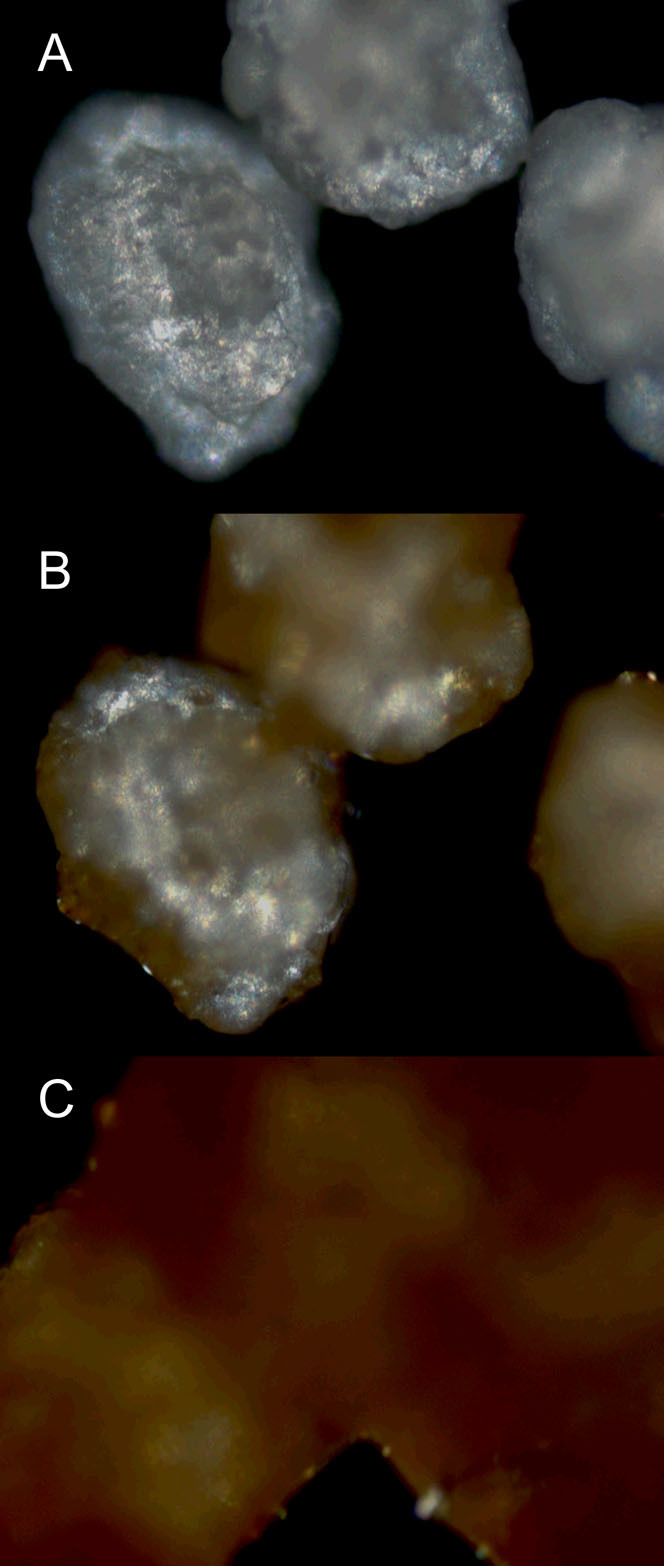
(A) presents the crystals after heating; (B) shows the pre-melting stage and (C) shows the complete melting/caramelization of the crystals.
Official websites use .gov
A
.gov website belongs to an official
government organization in the United States.
Secure .gov websites use HTTPS
A lock (
) or https:// means you've safely
connected to the .gov website. Share sensitive
information only on official, secure websites.
(A) presents the crystals after heating; (B) shows the pre-melting stage and (C) shows the complete melting/caramelization of the crystals.