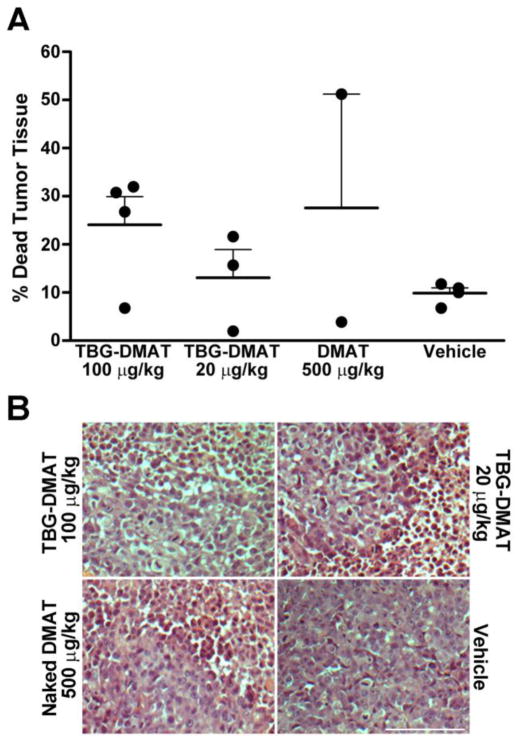
Figure 2. Effect of TBG-DMAT compared with DMAT on xenograft prostate tumors.
(A) Effect on xenograft tumor mass following treatment with TBG-DMAT or DMAT. Tumor tissue from PC3-LN4 xenografts was excised following treatment with vehicle (control), DMAT and TBG-DMAT. The tumors were weighed before and after removal of dead liquefied tissue, and the percent change in tumor mass was calculated. Means are presented and error bars represent SE. (B) Representative H&E staining of tumors following treatment of tumor bearing mice with TBG-DMAT, naked DMAT and vehicle. Scale bar is 100 μm.

