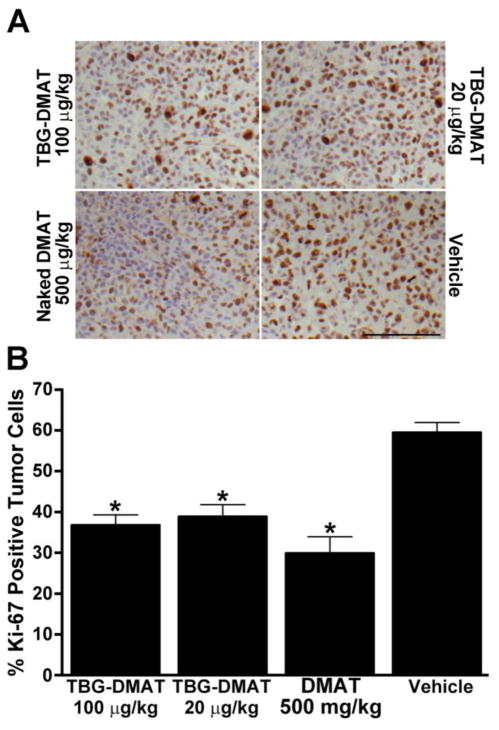
Figure 3. Analysis of Ki-67 expression in tumors following in vivo treatment with vehicle (control), DMAT and TBG-DMAT.
(A) Formalin fixed and paraffin embedded tumors were processed for Ki-67 immunohistochemistry. Representative pictures are shown. Scale bar is 100 μm. (B) The percent of Ki-67 positive cells was analyzed as described in Materials and Methods and is shown graphically. Least-Squares means are presented and error bars represent SE. * p < 0.002 relative to vehicle.

