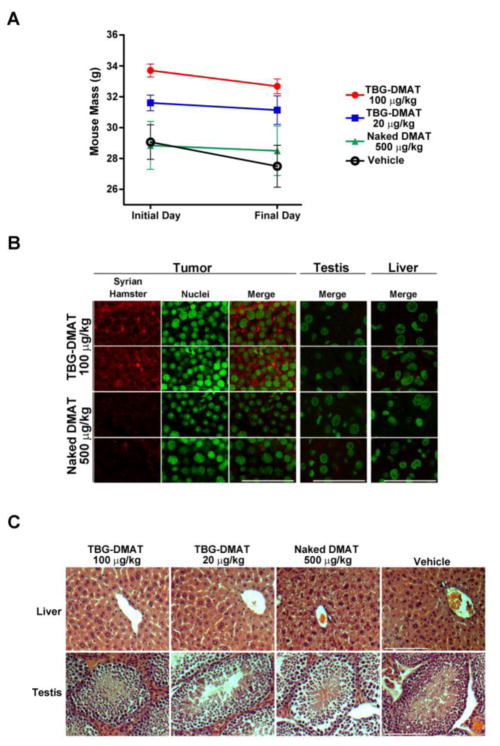
Figure 5. Lack of effects of TBG-DMAT treatment on mouse weight and organs and specific detection of TBG-DMAT in tumor.
(A) The mass of the mice on the initial treatment day and the final sacrifice day is graphed for each treatment group. Means are presented and error bars represent SE. (B) Detection of TBG-DMAT in tumor but not testis or liver. Tissue sections from mice treated with 100 μg/kg TBG-DMAT or 500 μg/kg naked DMAT were subjected to immunofluorescence analysis for Syrian hamster IgG. Nuclei were counterstained with Sytox® Green. Scale bar is 100 μm. (C) Representative H&E staining of liver and testis following treatment of tumor bearing mice with TBG-DMAT, naked DMAT and vehicle. Scale bar is 100 μm.

