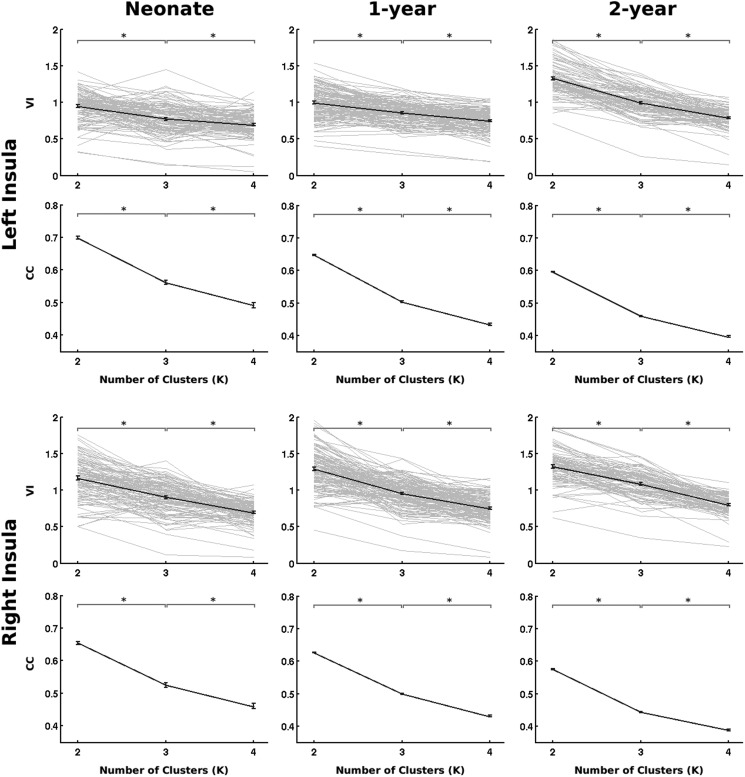
Figure 1.
The selection of optimal K for the whole sample. For each insula and age group, the VI (first row) and CC (second row) were plotted against the number of clusters (K = 2, 3, and 4). The individual VI curves are in light gray lines, while the bold line represents the group average. CC was measured in the group mean consensus matrix. Error bars denote the standard error of the mean. Asterisks denote significant difference (P < 0.05 after false discovery rate correction; paired t-tests for VI; 2-sample t-tests for CC).

