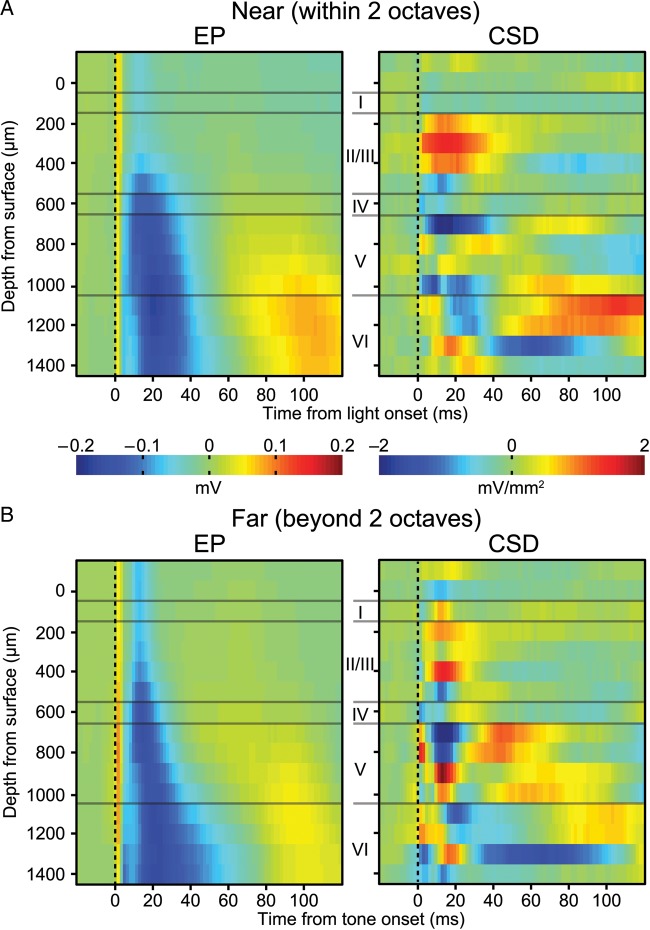
Figure 6.
Responses in V1 to microstimulation of A1. (A) Laminar EP and CSD profile for responses evoked by stimulation of sites in A1 with a best frequency within 2 octaves of the training tone frequency. (B) Same as (A), except for sites tuned >2 octaves away. On average both EP profiles show an infragranular pattern of activation that is similar to that seen for tone presentation during the test session.

