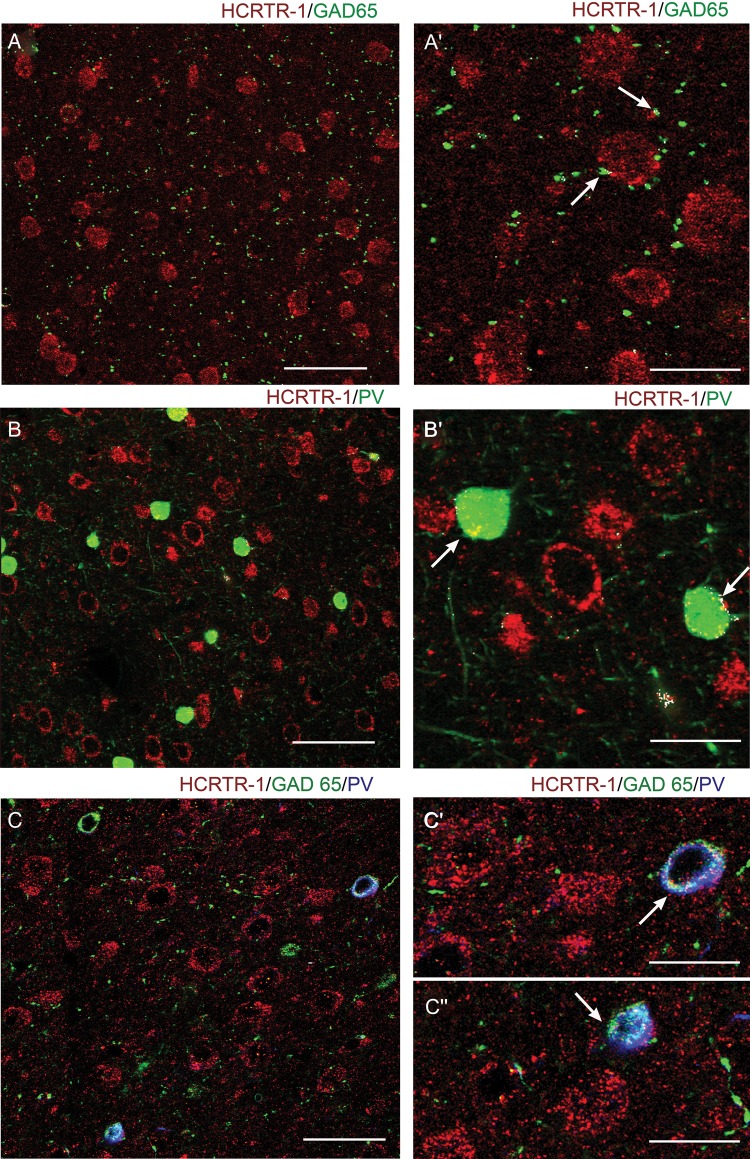
Figure 9.
Expression of HCRTR-1 in GABAergic cells. Confocal microscopy images of double and triple immunofluorescent staining for HCRTR-1, glutamic acid decarboxylase (65 kDa form; GAD65), and/or parvalbumin (PV) in layer V of Fr2. (A) and (A′) show, at different magnification, the distribution of HCRTR-1 (red) and GAD65 (green). Very little colocalization (white signal) characterized hypocretin receptor and GABAergic inhibitory terminals (arrows) contacting HCRTR-1+ neurons or processes. (B) and (B′) show, at different magnification, the distribution of HCRTR-1 (red) and PV (green). Colocalization (white) was detected only in cell bodies of a few interneuronal inhibitory cells (arrows). (C), (C′), and (C″) show, at different magnification, immunolabeling of HCRTR-1 (red), GAD65 (green), and PV (blue). White signal marks triple colocalization. A subpopulation of PV + GABAergic (GAD65+) interneurons expressed HCRTR-1. Scale bars: 50 μm (A, C); 60 μm (B); 25 μm (A′); 20 μm (B′, C′, C″).

