Figure 2.
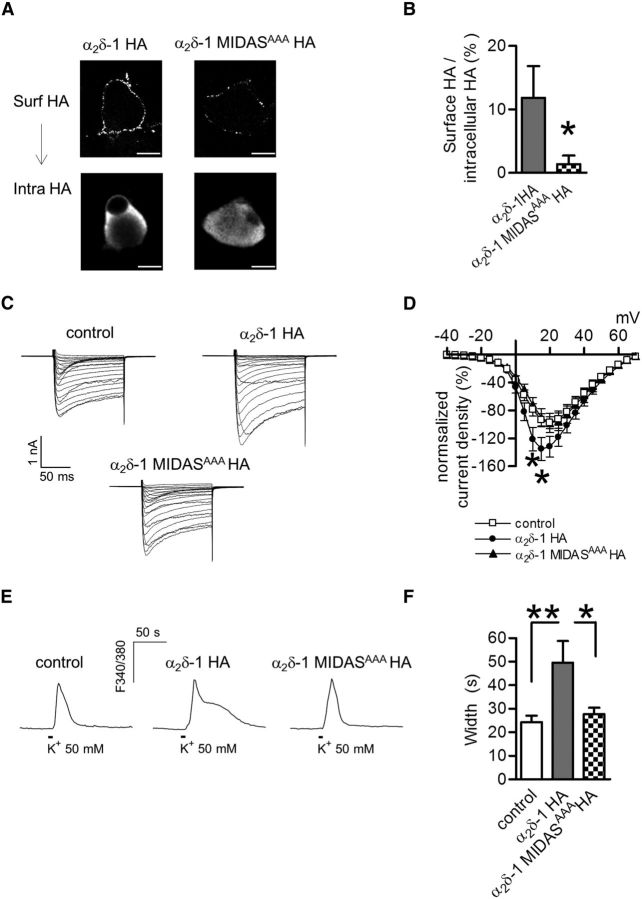
Expression of α2δ-1 MIDASAAA HA in DRG cultures. A, Confocal images of DRG neurons transfected with α2δ-1 HA or α2δ-1 MIDASAAA HA subunits. Top, Cell surface HA (Surf HA). Scale bar, 10 μm. Positively transfected neurons were identified following detection of intracellular HA-tagged proteins (intra HA, bottom). B, Quantification of surface HA fluorescence for wild-type α2δ-1 HA overexpressing neurons (gray bar; n = 9) and α2δ-1 MIDASAAA HA (checked bar; n = 5). Membrane HA signal was normalized against the intracellular HA content (*p = 0.01, Mann–Whitney test). C, Examples of families of IBa current traces for control, α2δ-1 HA and α2δ-1 MIDASAAA HA overexpressing DRG neurons. Currents were evoked from −90 mV holding potential in 5 mV steps from −40 to + 70 mV. The scale bars refer to all panels. D, Calcium channel current density-voltage relationship for control (□; n = 36), α2δ-1 HA (●; n = 32) and α2δ-1 MIDASAAA HA (▴; n = 16). In each experiment, current density (pA/pF) recorded in wild-type and mutant α2δ-1 HA overexpressing DRGs was normalized with respect to the control condition. At +10 and +15 mV, the current density of α2δ-1 HA overexpressing DRGs was significantly higher than the control condition (p = 0.02 one-way ANOVA and Dunnett's test, *p < 0.05). E, Example of high K+-evoked Ca2+ transients in control neurons (left), wild-type α2δ-1 HA (middle), and α2δ-1 MIDASAAA HA (right) overexpressing DRG neurons. F, α2δ-1 HA neurons (gray bar; n = 15) showed a prolonged response duration with respect to α2δ-1 MIDASAAA HA (checked bar; n = 15) and control (open bar; n = 15) DRGs (p = 0.006 one-way ANOVA and Bonferroni post hoc test; *p < 0.05, **p < 0.01).

