
Figure 5.
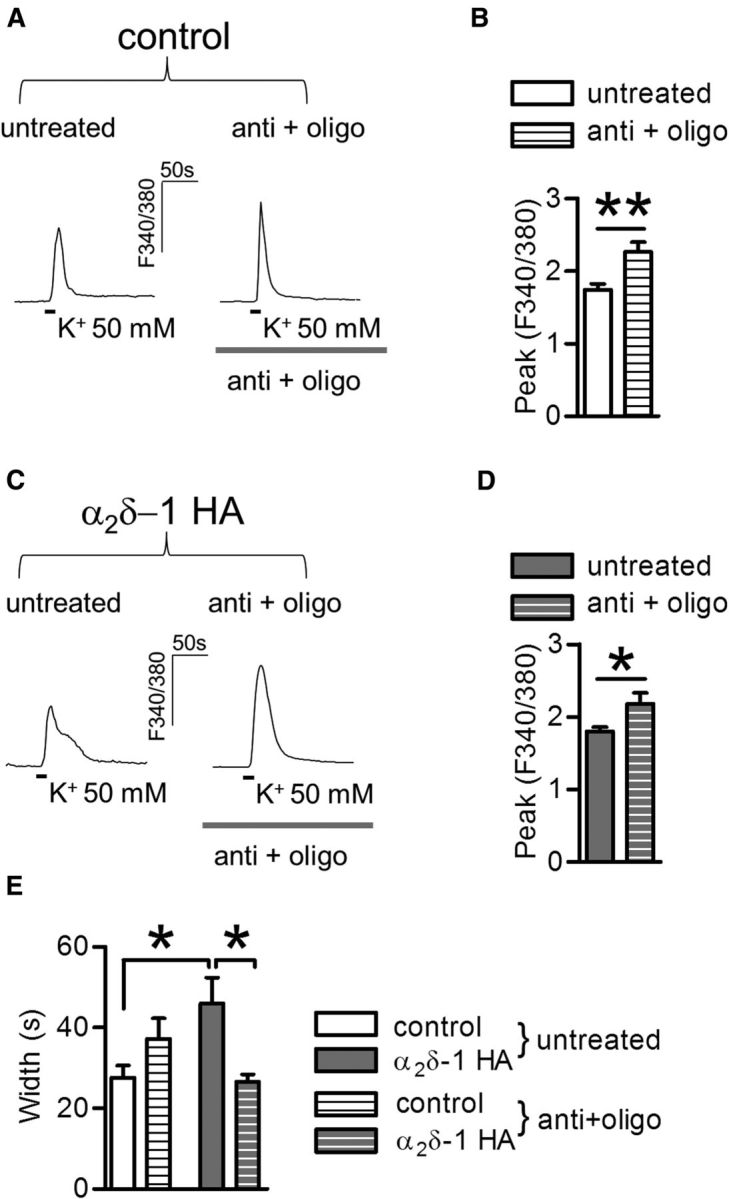
Role of mitochondria in the intracellular Ca2+ response in control and α2δ-1 HA overexpressing DRGs. A, High K+-triggered Ca2+ signals in the absence (left) or presence (right) of antimycin and oligomycin (anti + oligo; 5 min preapplication) in control DRG neurons. B, Quantification of peak response after the application of anti + oligo in control DRG neurons (striped bar;, n = 22) compared with untreated neurons (open bar; n = 19) processed in parallel. The peak amplitude of responses is increased by anti + oligo application (**p = 0.002, t test). C, Example of Ca2+ transients imaged in α2δ-1 HA overexpressing DRGs following anti + oligo pretreatment, as in A. D, Quantification of peak response after the application of anti + oligo in α2δ-1 HA overexpressing DRG neurons (gray striped bar; n = 20) compared with untreated neurons processed in parallel (gray bar; n = 27, *p = 0.03, t test). E, The increased Ca2+ transient duration mediated by α2δ-1 HA overexpression (gray bars) compared with control DRG neurons (open bars) is inhibited by anti + oligo treatment (striped bars; two-way ANOVA and Bonferroni post hoc test, *p < 0.05).