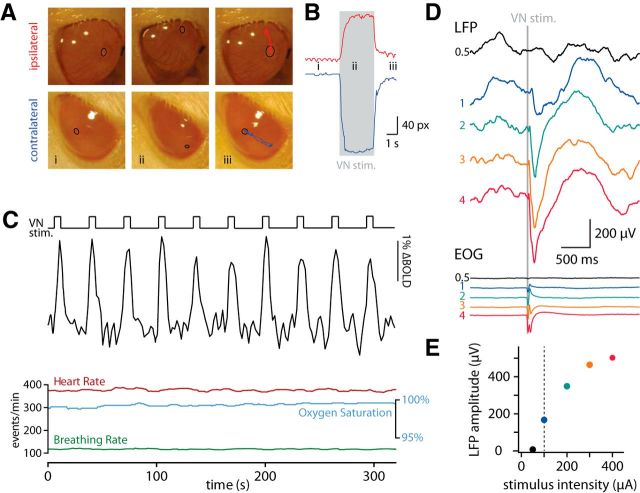
Figure 1.
VN stimulation during fMRI and LFP recordings. A, Still images from video recordings of the ipsilateral and contralateral eye before (i), during (ii), and after (iii) VN stimulation. The pupil, marked with a black ellipse, was tracked manually (iii) in NIH ImageJ Manual Tracker. B, Distance (in pixels) of the pupil from its start location. The time of the still images is marked. C, Time course of BOLD signal of the whole recorded volume and simultaneously recorded physiological parameters during VN stimulation. The nerve was stimulated for 6 s every 32 s with 0.1 ms pulses delivered at 333 Hz. D, LFPs recorded 1300 μm deep in retrosplenial cortex after VN stimulation (gray shaded area) of different intensities. Bottom, Electrooculograms (EOG) recorded from the contralateral eye. Averages of 48–52 trials. The different colors indicate different stimulation intensities expressed in multiples of eye-movement threshold determined at the beginning of the experiment (100 μA). E, LFP amplitude plotted against stimulation intensity (data from D). The dotted line represents the eye-movement threshold.

