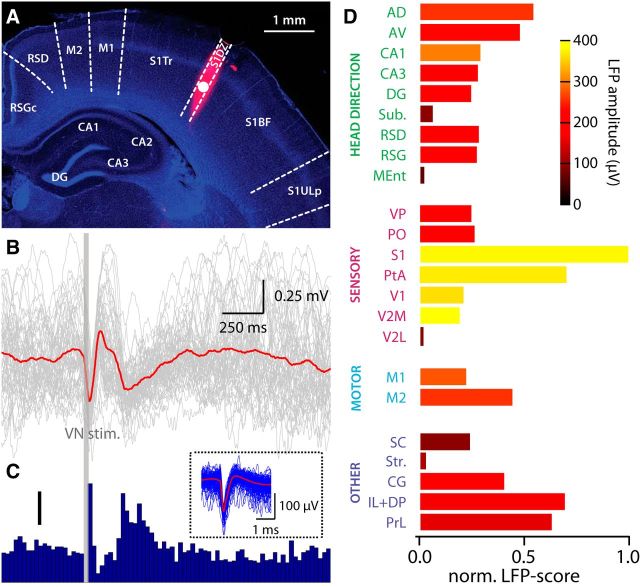
Figure 4.
VN stimulation-evoked electrophysiological signals. A, Coronal brain slice 3.0 mm posterior to bregma, showing recording electrode track (DiI, red) over a DAPI (blue) background. B, Evoked LFPs (gray, individual trials; red, average) recorded from 1200 μm deep in primary somatosensory cortex (white circle in A) after VN stimulation (dark gray bar). Average of 55 trials. C, Peristimulus time histogram showing evoked multiunit activity after VN stimulation (dark gray bar). Bin size, 25 ms. Scale bar, 0.5 spikes per trial. Inset, Two hundred individual spikes (blue) and average spike waveform (red) of multiunit signals. Same recording as A and B. D, Normalized evoked LFP scores from several different brain regions. The color coding shows the amplitude of the first negative peak in the LFP. Abbreviations according to Table 1.

