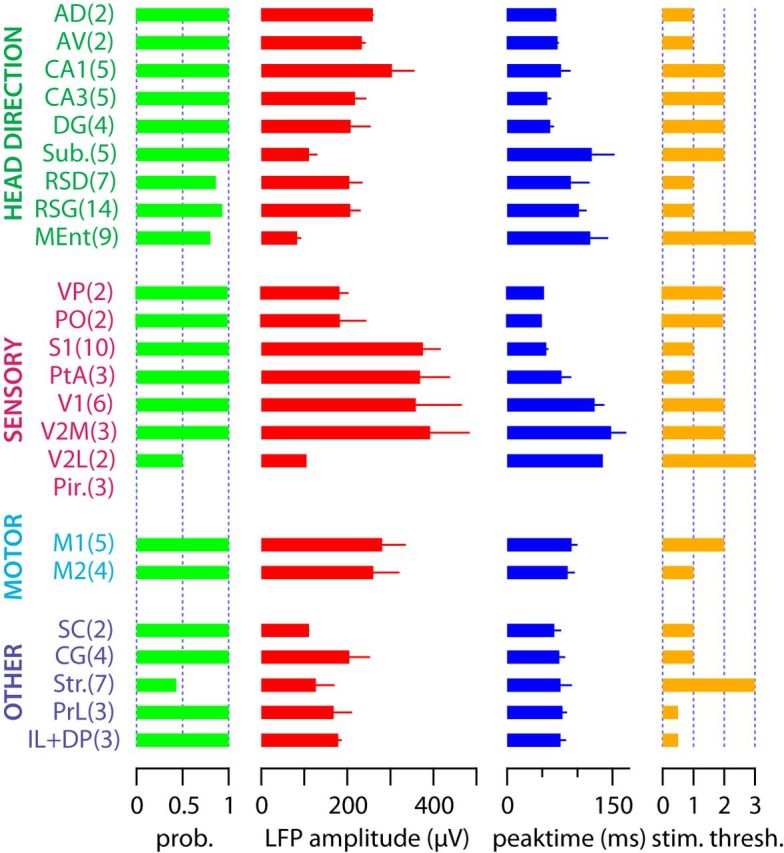
Figure 5.

Quantification of evoked LFP responses. The first column shows the probability of evoking LFP responses at three times the eye movement threshold. The second and third columns show the amplitude and time from stimulus onset of the negative peak of the evoked LFP signal, also at three times the eye-movement threshold. The fourth column shows the normalized stimulation threshold for evoking LFP responses expressed in eye-movement threshold units. Error bars denote SEM. Recorded brain areas have been grouped according to their function; the number of observations is in parentheses. No statistical comparisons between areas were made. Abbreviations according to Table 1.
