
Figure 2.
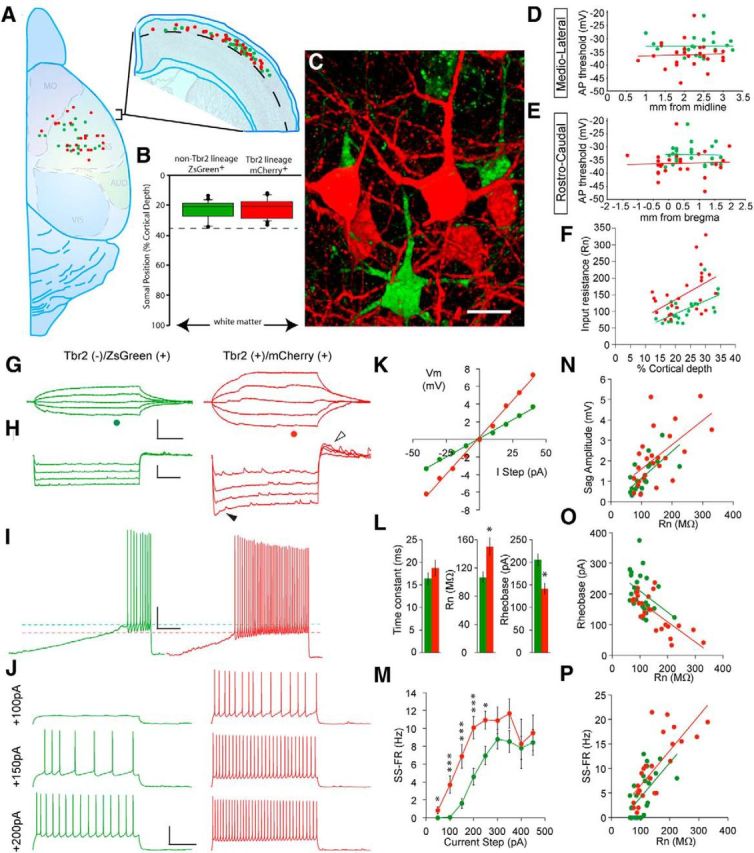
Non-Tbr2 and Tbr2 lineage neurons exhibit distinct electrophysiological properties. A, Positions of recorded cells within the rostrocaudal and mediolateral extent of the brain (left) and their depth within the cortex (right). B, Quantification of the depths of recorded cells indicates that all cells were colocalized by depth and contained within layers 2 and 3. C, Confocal 3D reconstruction of a field of Tbr2 (red) and non-Tbr2 (green) lineage neurons demonstrates that fate-mapped cells of the two lineages were closely neighboring. Scale bar, 10 μm. D, E, No significant correlations were found between action potential threshold and either mediolateral (D) or rostrocaudal position (E) of the recorded cells. F, Input resistance shows a positive correlation with cortical depth (R2 values, Tbr2 lineage = 0.256, non-Tbr2 lineage = 0.383; intercept coefficients, Tbr2 lineage = 33.5, non-Tbr2 lineage = 14.8; p < 0.02 and 0.01, respectively). G, Voltage responses of non-Tbr2 and Tbr2 lineage neurons to a series of subthreshold current steps demonstrating the significantly greater input resistance of the Tbr2 lineage neuron. H, The voltage sag (closed arrowhead) and rebound depolarization (open arrowhead) evoked by identical hyperpolarizing current steps is greater in the Tbr2 lineage neuron. I, Voltage responses to slow depolarizing current ramps demonstrate that the Tbr2 lineage neuron has a lower rheobase (dashed red line) than the non-Tbr2 lineage neuron (dashed green line). J, The Tbr2 lineage neuron exhibits higher rates of evoked action potential firing at each depolarizing current step, as shown in the representative voltage responses. Calibrations: G, 5 mV, 50 ms; H, 20 mV, 2 s; I, 5 mV, 500 ms; J, 40 mV, 500 ms. K, Voltage-current plot of non-Tbr2 (green) and Tbr2 (red) lineage neurons voltage responses to subthreshold current steps (at time points indicated by green and red dots below the current traces in G). L, Bar graphs demonstrating significant differences in input resistance and rheobase, but not membrane time constant, in neurons from the two lineages. *p < 0.05. M, Mean f-I plot depicting higher rates of evoked action potential firing in Tb2 lineage neurons. The first five data points are significantly different: 50 pA, *p < 0.05; steps 100–200 pA, ***p < 0.001; step 250 pA, **p < 0.008. N–P, Scatter plots demonstrating significant linear relationships (p < 0.05 for all) between Rn and depolarizing sag potential (R2 values, Tbr2 lineage = 0.343, non-Tbr2 lineage = 0.447), Rn and rheobase (R2 values, Tbr2 lineage = 0.559, non-Tbr2 lineage = 0.158), and Rn and steady-state firing rate evoked by a 200 pA step (R2 values, Tbr2 lineage = 0.570, non-Tbr2 lineage = 0.338).