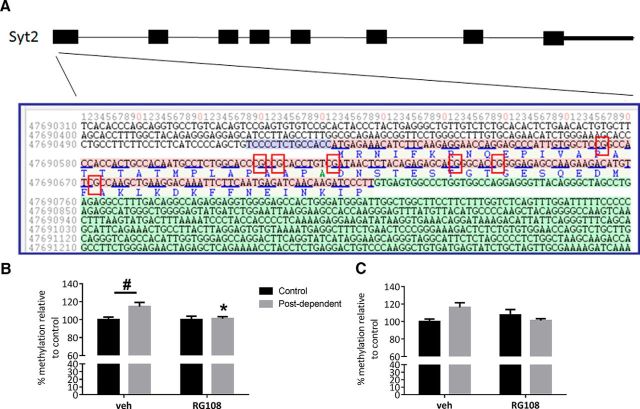
Figure 7.
History of alcohol dependence increases DNA methylation on exon 1 of syt2. A, Figure shows sequence of exon 1 of syt2 and the location of the 7 CpG sites. Bar graph represents DNA methylation level (%) at CpG#5 (B) and at CpG#6 (C) on exon 1. Black bars indicate mean values (± SEM) of control rats. Gray bars indicate mean values (± SEM) of PD rats. #p < 0.05, control versus PD rats. *p < 0.05 vehicle versus RG108.

