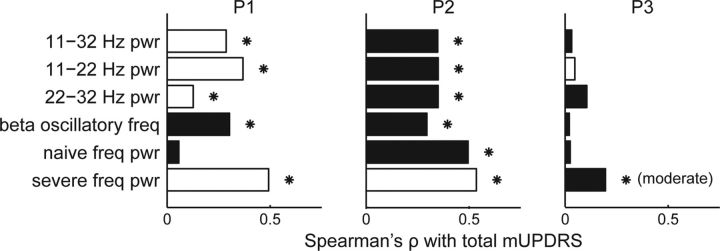
Figure 4.
Correlation between LFP features and total mUPDRS. Bars indicate the magnitude of Spearman's ρ correlation between specific beta features and total mUPDRS scores over all disease states grouped by individual subject (P1, P2, and P3). Features include the power (pwr) in the overall, low, and high beta bands; the frequency of beta oscillations (only for recordings with a significant beta oscillation); the power at the median frequency of beta oscillations over all naive recordings; and the power at the median frequency of beta oscillations over all severe recordings. White bars indicate positive correlations, black bars indicate negative correlations, and asterisks indicate significant correlations (Spearman's ρ, α = 0.05).

