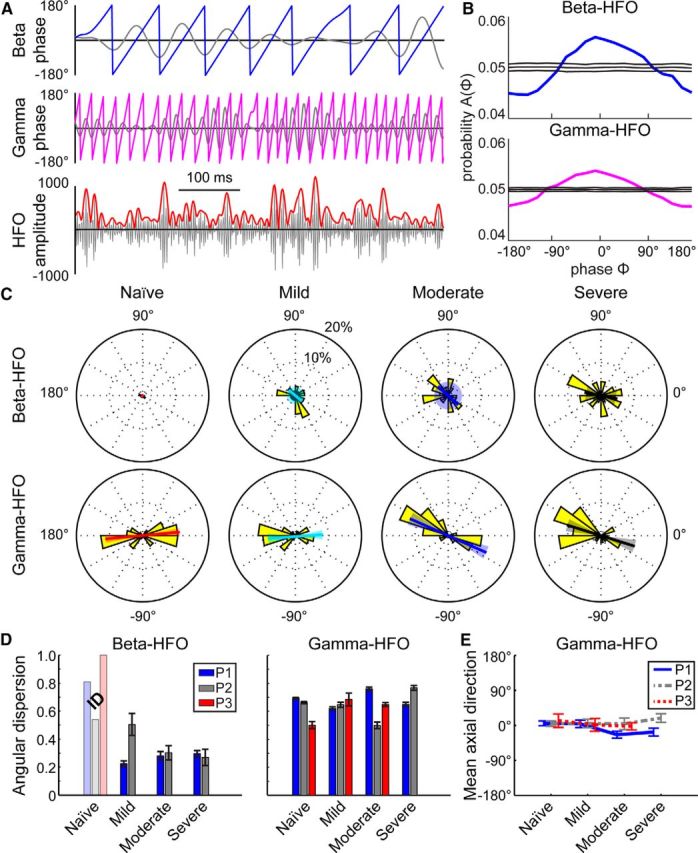
Figure 6.

Differences in the locking of HFO amplitude to phases of beta and gamma oscillations for subject P1. A, Examples of beta (11–16 Hz, blue) and gamma (45–64 Hz, magenta) phase signals with simultaneous HFO (256–362 Hz, red) amplitude signal from an LFP in the severe state. Bandpass filtered data are shown in gray. B, Coupling was measured by comparing the phase-amplitude distribution (bold line) with a distribution of time-shuffled surrogates (mean ± 2 SD, shown with thin lines) for beta-HFO (top, blue) and gamma-HFO (magenta, bottom) pairs. C, In subject P1, radial histograms of the phase at which the phase-amplitude distribution in B was peaked for recordings with significant PACz-scores (yellow). Beta was defined as 11–16 Hz, gamma as 45–64 Hz, and HFO as 256–362 Hz for all recordings. The bold colored line shows the mean axial direction with the shaded area representing the 95% confidence interval. For beta-HFO mild and moderate states, there was no significant axial direction as tested by the Omnibus test, so the 95% confidence interval encompasses the entire circle. D, Angular dispersion (0 represents dispersed angles, 1 represents aligned angles) and jackknife error bars of the radial distributions shown in C for all subjects and all parkinsonian states (P1, blue; P2, gray; P3, red). For all subjects, there were not enough recordings (N < 6, insufficient data, marked ID) with a significant beta-HFO modulation index to perform the dispersion analysis in the naive state (and in the mild and moderate states in P3; faded bars). E, Mean axial direction with 95% confidence interval for all subjects and parkinsonian states for gamma-HFO coupling. Beta-HFO coupling is not shown because the distributions were not different from uniform, as tested by the Omnibus test.
