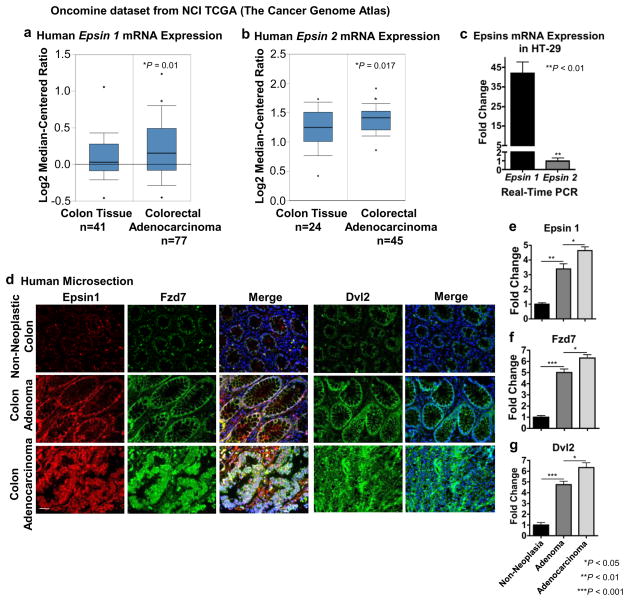
Figure 1. Epsins were augmented in human colon cancer.
(a,b) Human epsin 1 (a) and epsin 2 (b) mRNA expression levels in normal colon and colorectal adenocarcinoma tissues. Data was retrieved from NCI The Cancer Genome Atlas (TCGA) Oncomine dataset. (c) qRT-PCR analysis of epsin 1 and epsin 2 mRNA expression in HT-29 human colon cancer cells, n=9. (d) Representative immunofluorescence images of epsin 1, Fzd7, and Dvl2 in peripheral non-neoplastic, adenoma and adenocarcinoma colon tissues from an AccuMax human tissue microarray. Scale bar: 50 μM. (e,f,g) Quantification of d, n=12. All statistical values were calculated using a Student’s t test; P values are indicated. Error bars indicate the mean ± s.e.m.

