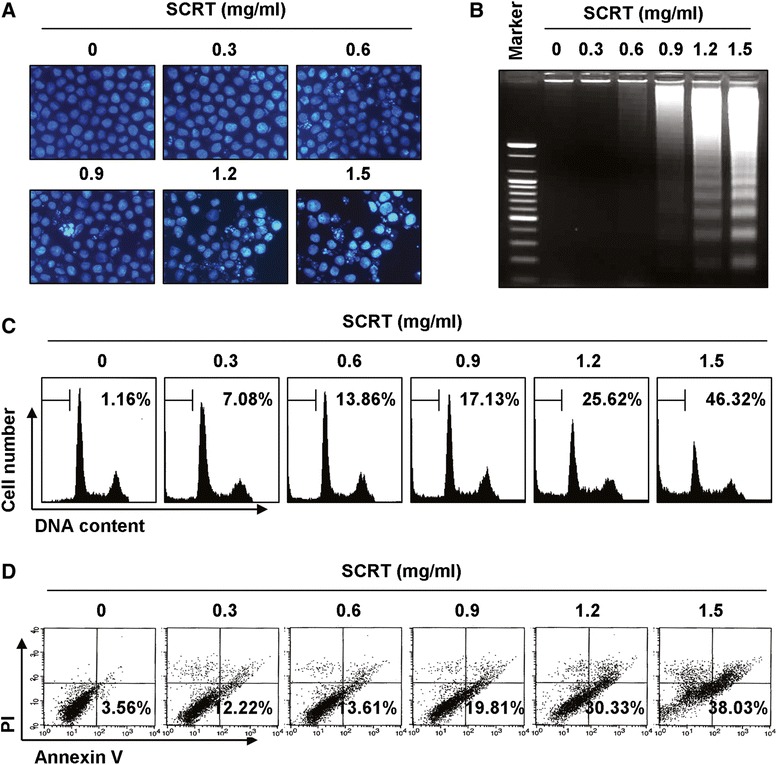
Figure 2.

SCRT induces apoptosis in A549 cells. (A) Cells were treated with the indicated concentrations of SCRT for 72 h, fixed, and stained with DAPI solution. The stained nuclei were observed under a fluorescent microscope (original magnification 400x). (B) For the analysis of DNA fragmentation, genomic DNA from cells grown under the same conditions as (A) was extracted, separated by 1.5% agarose gel electrophoresis, and visualized under UV light after staining with EtBr. The DNA marker indicates the size of the fragments of the DNA ladder. (C) To quantify the degree of apoptosis induced by SCRT, cells were evaluated by a flow cytometer for sub-G1 DNA content, which represents the cells undergoing apoptotic DNA degradation. (D) The cells were stained with annexin V-FITC and PI, and the percentages of apoptotic cells (annexin V+ cells) were then analyzed using flow cytometric analysis. (C and D) The data is the mean of the two different experiments.
