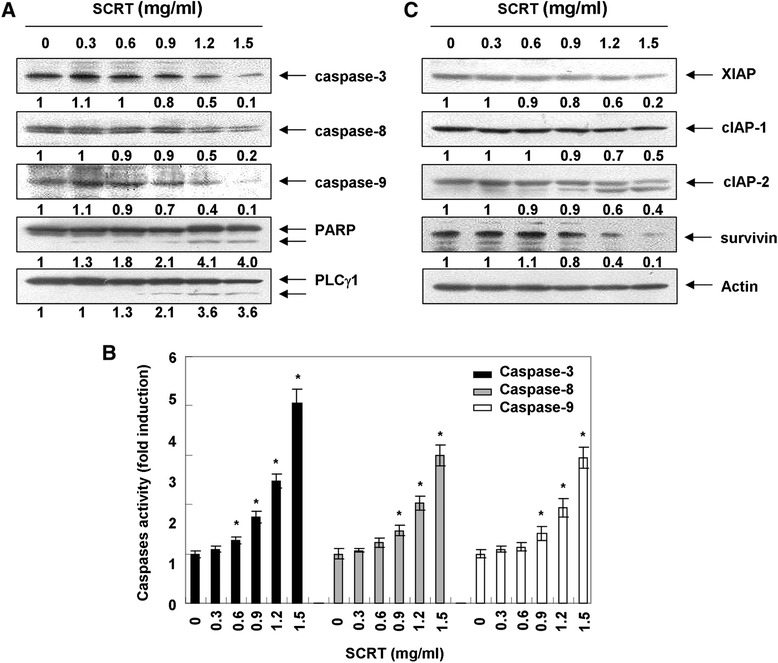
Figure 3.

Activation of caspases, degradation of PARP and PLC-γ1, and down-regulation of the IAP family proteins by SCRT in A549 cells. (A and C) Cells were treated with the indicated concentrations of SCRT for 72 h. The cells were lysed, and the cellular proteins were visualized using the indicated antibodies and an ECL detection system. Actin was used as an internal control. The experiment was repeated three times and similar results were obtained. The relative ratios of expression in the results of the Western blotting were presented at the bottom of each of the results as relative values of the actin expression. (B) After 72 h incubation with the indicated concentrations of SCRT, the cells were lysed, and aliquots (50 μg protein) were assayed for in vitro caspase-3, −8 and −9 activity using DEVD-pNA, IETD-pNA and LEHD-pNA as substrates, respectively, at 37°C for 1 h. The released fluorescent products were measured. The data are expressed as the mean ± SD of three independent experiments. The significance was determined by the Student’s t-test (*p < 0.05 vs. untreated control).
