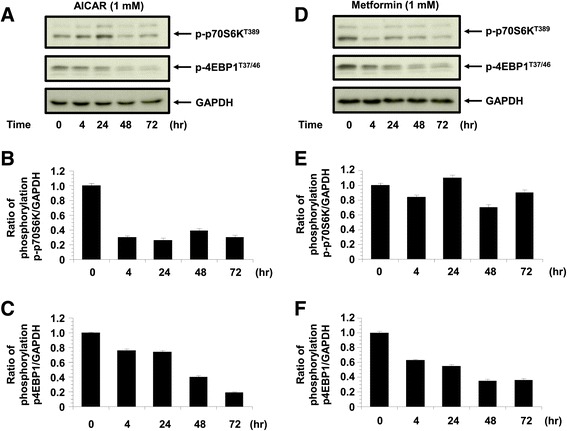
Figure 5.

The phosphorylation of p4E-BP1 and p70S6kinase. The phosphorylation of p4E-BP1 and p70S6kinase in KGN cells treated with AICAR (1 mM) and metformin (1 mM) (n = 4). The phosphorylation of p4E-BP1 and p70S6kinase was quantified against GAPDH. A: Representative blots illustrating the effect of treatment on pAMPK and GAPDH by AICAR (1 mM) for 4 h to 72 h (n = 4). The blot layout is in the same order as the graph in panels B (p70S6K) and C (4E-BP1), respectively. D: Representative blots illustrating the effect of treatment on pAMPK and GAPDH by metformin (1 mM) for 4 h to 72 h (n = 4). The blot layout is in the same order as the graph in panels E (p70S6K) and F (4E-BP1), respectively.
