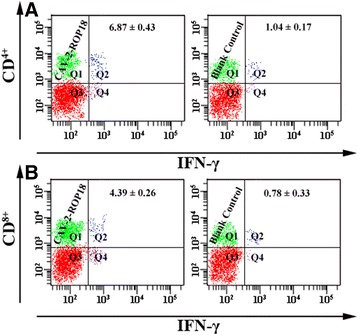
Figure 7.

The expression of IFN-γ on CD 4+ and CD 8+ T cells using flow cytometry analysis. The percentages of IFN-γ-producting cells inside CD4+ T cell gate (A) and IFN-γ-producting cells inside CD8+ T cell gate (B) in mice spleen cells. Data are reported as mean ± SD.
