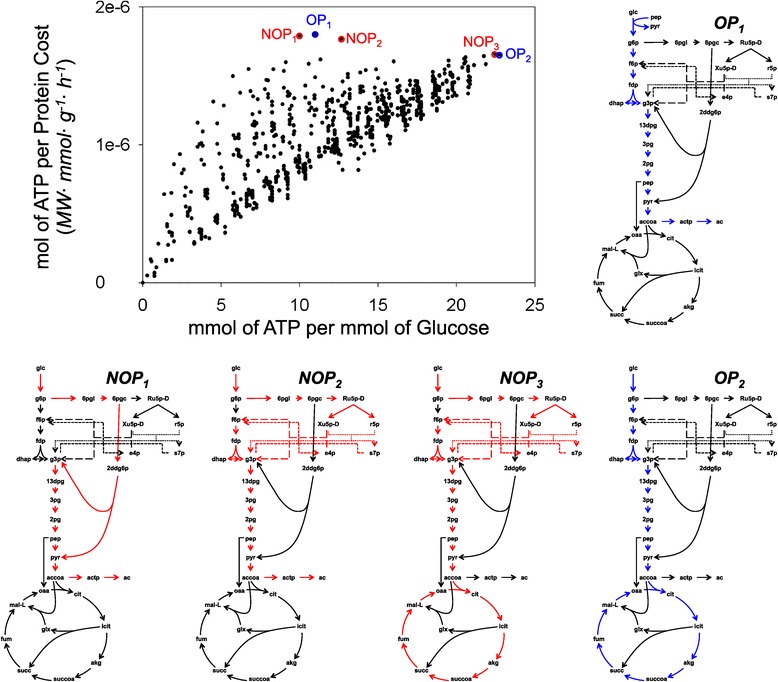
Figure 4.

Fundamental pathway analysis. ATP production potential of energy producing fundamental pathways, compared to the associated protein cost of each mmol of ATP. Optimal (OP) and Near Optimal (NOP) Pathways are highlighted in the scatter plot. OPs are plotted in blue and NOPs in red in the central carbon metabolism diagrams
