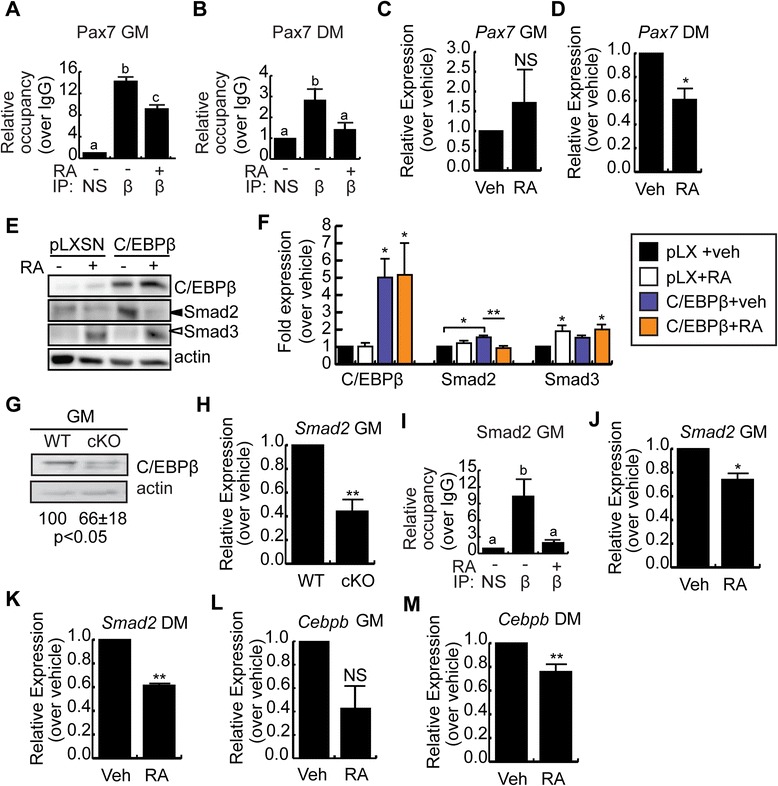
Figure 4.

RA interferes with C/EBPβ occupancy of target genes. (A) C/EBPβ occupancy of the Pax7 promoter in C2C12 myoblasts in GM after 24-h +/- RA. n = 3. (B) C/EBPβ occupancy of the Pax7 promoter in C2C12 myoblasts after 24-h in DM, +/-RA. n = 3. (C) Pax7 expression in C2C12 myoblasts after 24 h +/- RA in GM. n = 3. (D) Pax7 expression in C2C12 myoblasts after 24 h +/-RA in DM. n = 3. (E) Smad2/3 and C/EBPβ expression in C2C12 myoblasts retrovirally transduced to express C/EBPβ or with empty virus (pLXSN) +/- RA for 48 h in GM. Actin is the loading control. (F) Quantification of blots from (E); *P < 0.05, compared to vehicle-treated empty virus controls; **P < 0.01, compared to C/EBPβ-overexpressing vehicle-treated cells, n ≥ 3. (G) C/EBPβ expression in primary myoblasts from C/EBPβ conditional null (cKO) or control (WT) muscle in GM.. Quantification of three trials is indicated, with control set to 100, P < 0.05. (H) Smad2 expression in control (WT) and cKO myoblasts in GM. n = 3. (I) ChIP analysis of C/EBPβ occupancy of the Smad2 promoter in C2C12 myoblasts after 24-h +/- RA in GM. n = 3. (J) Smad2 expression in C2C12 myoblasts treated for 24 h +/-RA in GM. n = 3. (K) Smad2 expression in C2C12 myoblasts treated for 24 h +/-RA in DM. n = 3. (L) Cebpb expression in cells cultured as in (J). (M) Cebpb expression in cells cultured as in (K). n = 3. For all graphs, data is the mean +/- SEM. Means marked with different letters are statistically different from one another, meeting a minimum cutoff of P < 0.05. *P < 0.05, **P < 0.01. NS = non significant.
