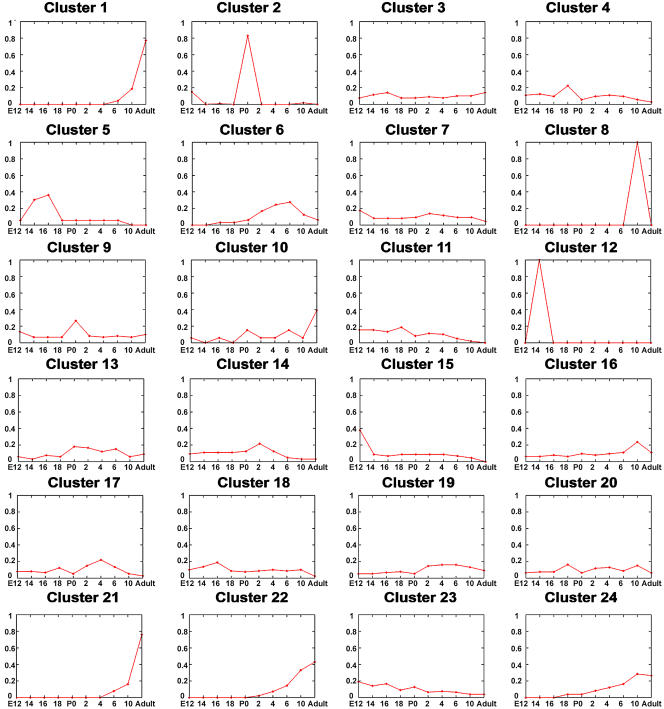
Figure 1. Median Plot of SAGE Tag K-Means Cluster Analysis Using 24 Clusters.
Tags present at greater than 0.1% in one or more of the ten wild-type total retina libraries are considered. SAGE libraries are plotted on the x-axis, and tag abundance, plotted as a fraction of the total tags for a gene in the library in question, is shown on the y-axis. A full list of tags and their abundance levels used for the analysis is detailed in Table S3.

