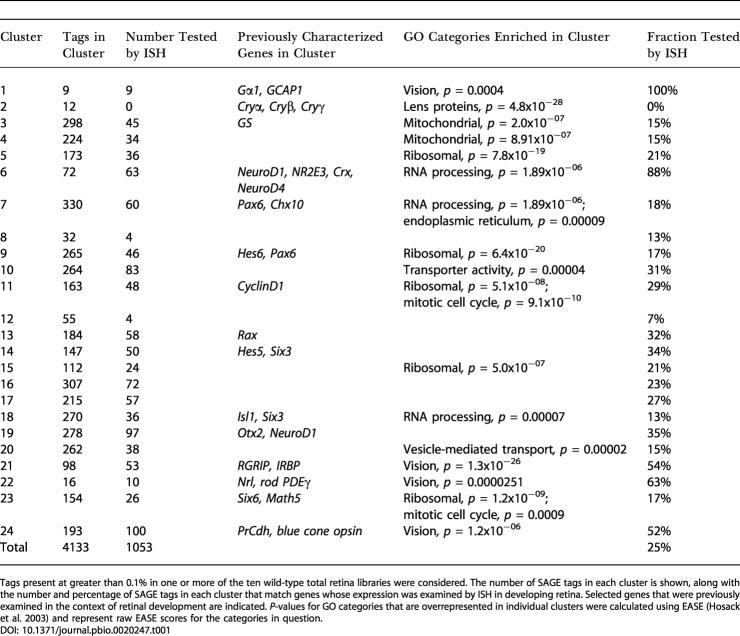
Table 1. Summary of SAGE Tag K-Means Cluster Data.
Tags present at greater than 0.1% in one or more of the ten wild-type total retina libraries were considered. The number of SAGE tags in each cluster is shown, along with the number and percentage of SAGE tags in each cluster that match genes whose expression was examined by ISH in developing retina. Selected genes that were previously examined in the context of retinal development are indicated. P-values for GO categories that are overrepresented in individual clusters were calculated using EASE (Hosack et al. 2003) and represent raw EASE scores for the categories in question

