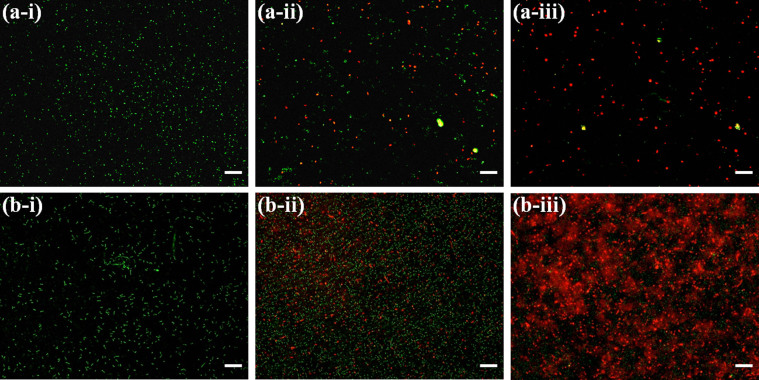
Figure 5. Fluorescence microscopic images of the green and red fluorescence stained B. subtilis and E. coli in absence and presence of p-ZnONP; B. subtilis (a-i), B. subtilis in presence of 100 μg/mL of p-ZnONP (a-ii), and 250 μg/mL of p-ZnONP (a-iii), E. coli (b-i), E. coli in presence of 50 μg/mL of p-ZnONP (b-ii), and 250 μg/mL of p-ZnONP (b-iii).
The scale bars represent for 20 μm.

