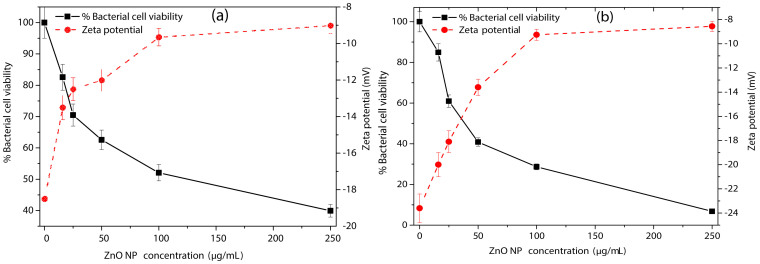
Figure 7. Effect of p-ZnONP on bacterial cell viability and surface zeta potential of B. subtilis and E. coli cells.
B. subtilis (a) and E. coli (b) cells were treated with increasing concentrations of p-ZnONP like 16, 25, 50, 100, 250 μg/mL. Solid black lines represent the relative percentage of viable bacterial cells, whereas dashed red lines correspond to zeta potential values at different concentrations of p-ZnONP. Triplicate experiments were done for each reactions, and error bar represents the standard error of mean.

