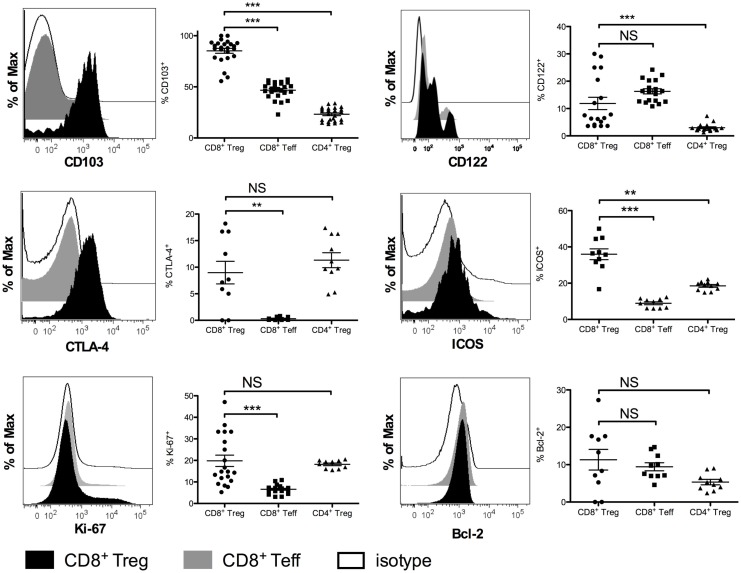
Figure 3.
Phenotypic characterization of CD8+CD25+FOXP3+ Tregs (CD8+ Tregs) compared with CD8+CD25−FOXP3−effector CD8+ T cells (CD8+ Teffs) and with CD4+CD25+FOXP3+ Tregs (CD4+ Tregs) in female BALB/c mice. Representative histograms showing expression of CD103, CTLA-4, Ki-67, CD122, ICOS, and Bcl-2 in CD8+ Teffs (gray) and in CD8+ Tregs (black) compared to isotype control (white) are shown. Corresponding percentages in the overall population are shown. Individual values and mean ± SEM are shown.

