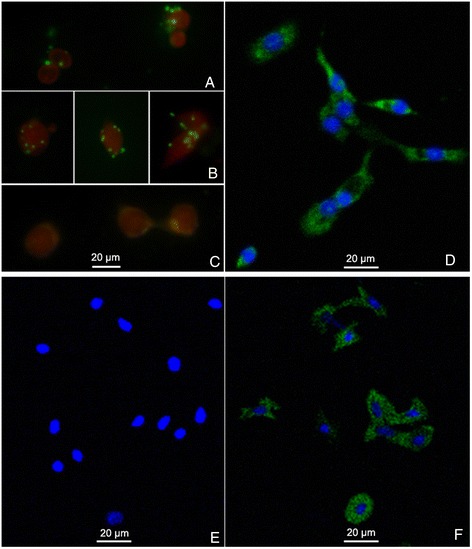
Figure 2.

Localization of BP53 in hemocytes by immunofluorescence assay. (A) and (B), Normal shrimp hemocytes incubated with anti-BP53 polyclonal antibody, which showed punctate structures distributed over the entire cell surface. (C), Negative control. Normal shrimp hemocytes incubated with pre-immune rabbit serum instead of anti-BP53 polyclonal antibody, which had no detectable fluorescence signal. (D), Permeabilized shrimp hemocytes incubated with anti-BP53 polyclonal antibody, which showed the intracellular expression of BP53 in a characteristic reticular pattern. (E), Normal hemocytes incubated with anti-actin antibody as control group, which didn’t show any positive signals. (F), Permeabilized cells incubated with anti-actin antibody, while showed positive actin signals. Evans blue was used to visualize intact cells, and DAPI was used to visualize nuclei.
