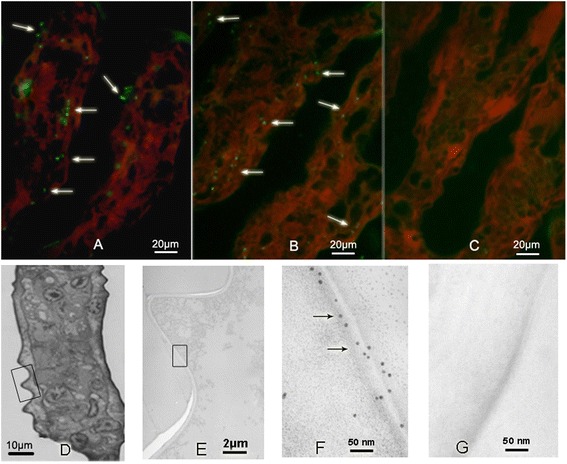
Figure 3.

The localization of BP53 in gill secondary filaments. The expression of BP53 was analyzed by immunofluorescence microscopy and immunogold electron microscopy, respectively. (A) and (B), Gill tissues incubated with anti-BP53 polyclonal antibody, the fluorescence signals were developed by FITC-conjugated HRP, which showed numerous green spots distributed along the cuticular epithelium of gills. Pre-immune serum staining was performed as negative control (C), of which no green fluorescence spot was observed. Evansblue was used to visualize gill tissue, which showed red color under 550 nm laser light. (D), Histological slide of gill tissue observed under microscopy (1000 x), T-E stained. (E), The framed part of picture D was observed under electron microscopy. (F), Enlarged picture of part of the membrane picture E, which showed golden particles appeared along the cell membrane of the epithelium under the cuticle of gills. (G), Negative control, pre-immune serum was used as primary antibody instead of anti-BP53 Ab. Arrows point positive staining.
